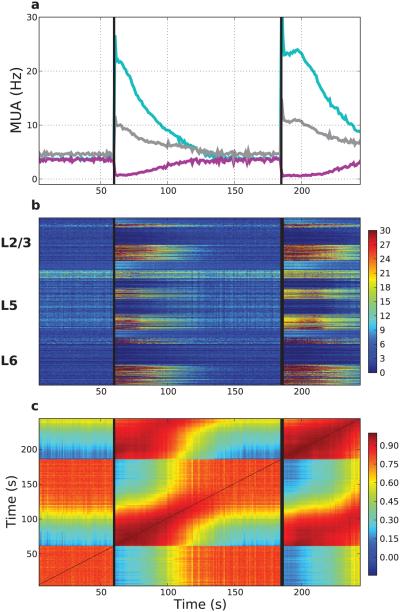
Figure 9. Network ensemble dynamics show distinct states at baseline and during expression of persistent activity.
(a) Persistent activity lasts >60 s after each identical AMPAR/NMDAR/mGLUR stimulation. Vertical lines represent the stimulus times (60, 185 s; same population of 50% of E neurons across layers). MUA created with 1 s bins. Purple (light-blue) represent stimulated (non-stimulated) E neurons; gray MUA of interneurons. (b) Firing-rate vectors (1 s intervals) transition at onset/offset of persistent activity. Color at time= x, neuron= y represents the firing rate of neuron y during the 1 s interval at time x. Neurons arranged in layers from top (L2/3) to bottom (L6). (c) Pairwise Pearson correlations between all firing rate vectors from (b). Color at times t1 = x, t2 = y indicates Pearson correlation between firing-rate vectors at those times.

