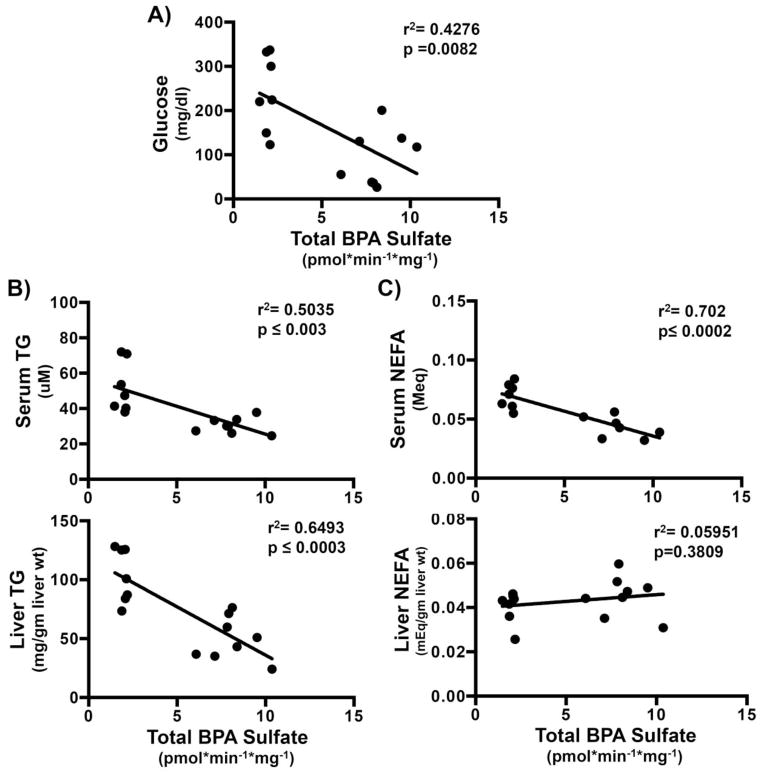
Figure 7. Increased triglyceride and glucose concentrations are associated with decreased BPA sulfonation.
Corrrelation of total BPA sulfonation in WT and ob/ob fed and fast (n=3/group) mouse cytosol with (A) serum glucose (mg/dl), (B) serum (uM) and liver triglycerides (mg/g liver wt) (TG) and (C) serum (MEq) and liver non-esterified fatty acids (NEFA) (MEq/gm liver wt). Correlations were obtained by Pearson correlation using GraphPad Prism 6. P< 0.05 were considered significant.

