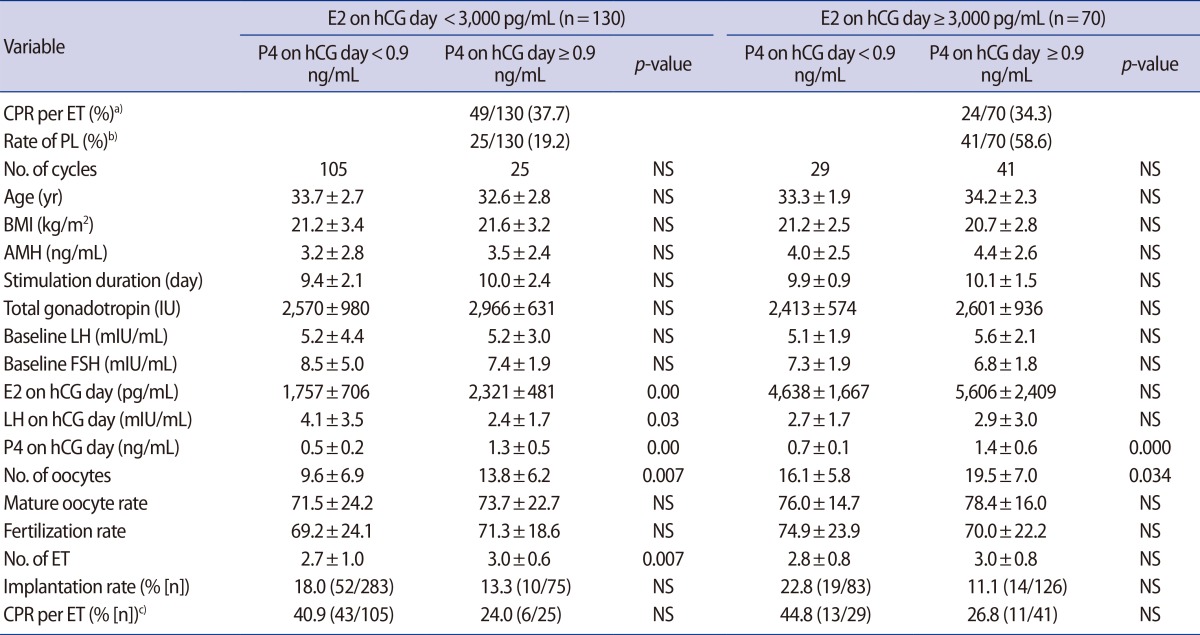
Table 3. Subgroup analysis according to estradiol levels at the time of human chorionic gonadotropin administration.
Values are presented as number (%) or mean±standard deviation.
E2, estradiol; hCG, human chorionic gonadotropin; P4, progesterone; CPR, clinical pregnancy rate; ET, embryo transfer; PL, premature luteinization; NS, not significant; BMI, body mass index; AMH, anti-Müllerian hormone; LH, luteinizing hormone; MCD, menstrual cycle day; FSH, follicle-stimulating hormone.
a)p=0.648; b)p=0.001; c)Tested using the chi-square test.

