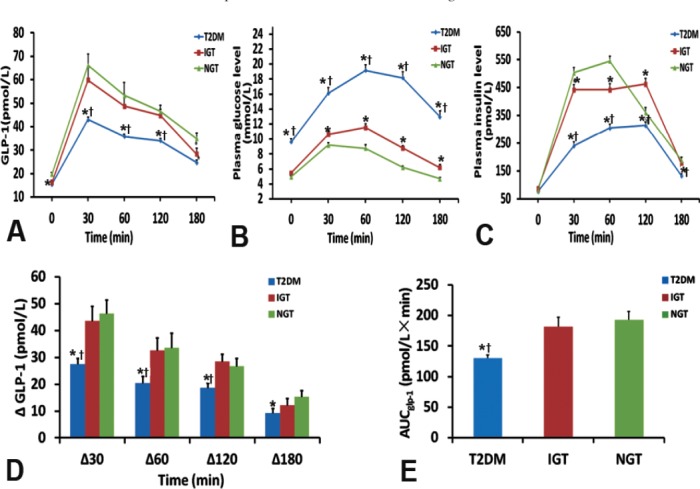
Figure 1.

Comparisons of glucagon-like peptide-1 (GLP-1), glucose and insulin levels, incremental (∆) GLP-1 levels, and AUCglp-1 during OGTT among the 3 groups: A) GLP-1 levels, B) glucose levels, C) insulin levels, D) incremental GLP-1 levels from 30 to 180 minutes, and E) AUCglp-1. *significant difference (p<0.05) versus normal glucose tolerance (NGT), †significant difference (p<0.05) versus impaired glucose tolerance (IGT). T2DM - type 2 diabetes mellitus
