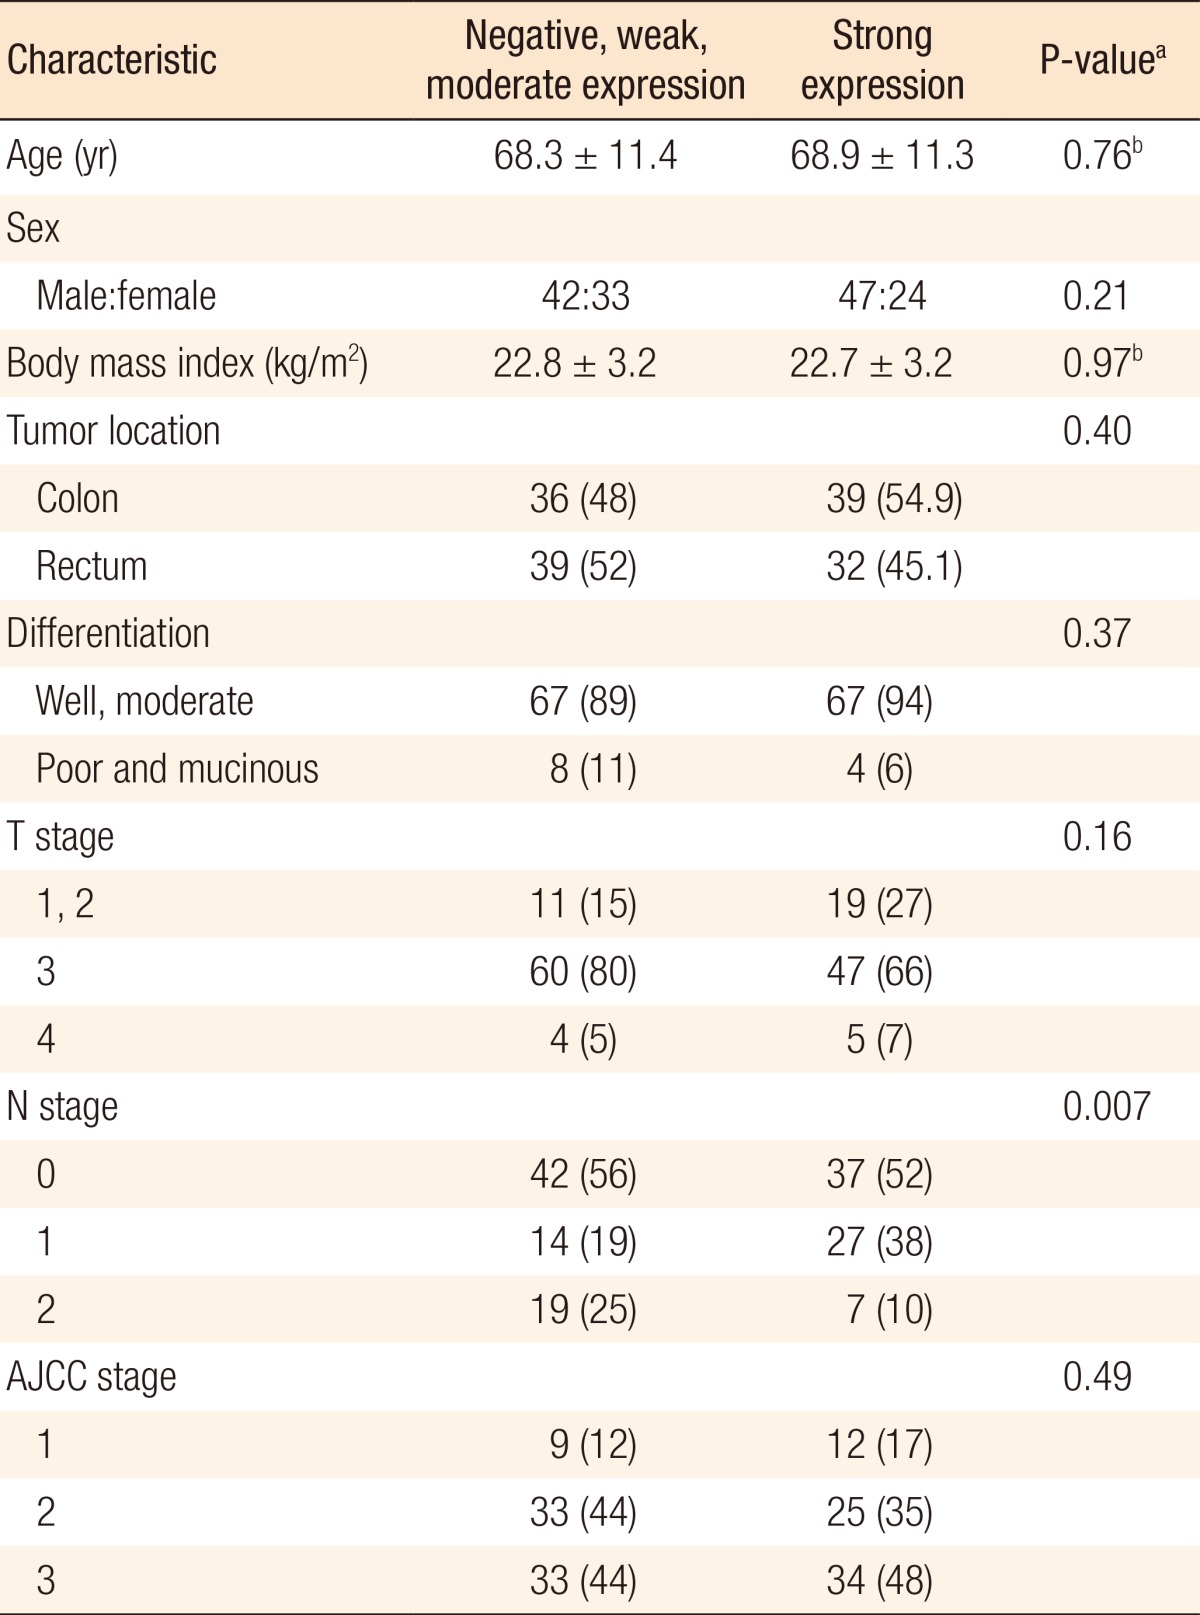
Table 2. Comparison of clinicopathological data for the two leptin expression groups.

Values are presented as mean ± standard deviation or number (%).
AJCC, American Joint Committee on Cancer.
aPearson chi-square test. bStudent t-test.

Values are presented as mean ± standard deviation or number (%).
AJCC, American Joint Committee on Cancer.
aPearson chi-square test. bStudent t-test.