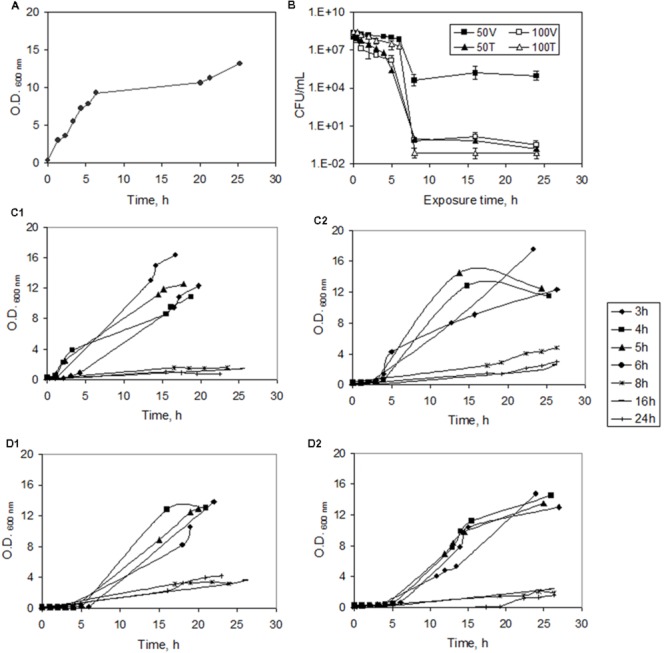
FIGURE 1.

Inducing persister formation in Staphylococcus aureus. (A) Growth curve of normal cells in MHB. (B) Time-dependent killing curve during exposure to 50 and 100 mg/L of vancomycin (V) and teicoplanin (T). The CFU/mL data are represented in logarithm scale. (C) Growth curves of S. aureus in fresh MHB after exposure to 50 (C1) and 100 (C2) mg/L vancomycin for 3, 4, 5, 6, 8, 16, and 24 h. (D) Growth curves of S. aureus in fresh MHB after exposure to 50 (D1) and 100 (D2) mg/L teicoplanin for 3, 4, 5 and 6, 8, 16, and 24 h. Error bars represent standard deviation values.
