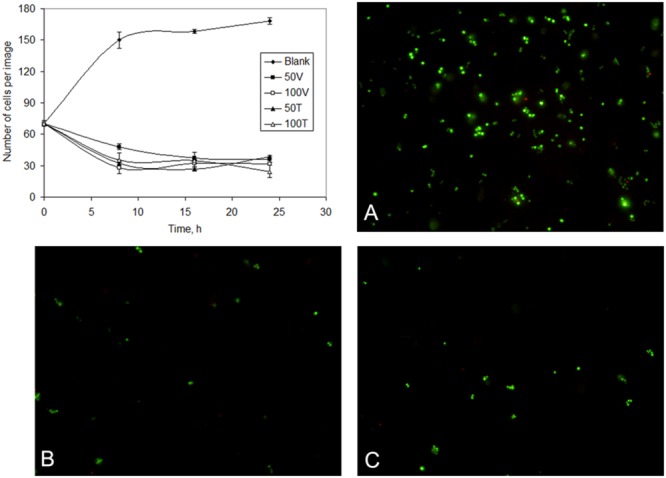
FIGURE 2.

Number of cells of S. aureus cells observed per image (chart) in unchallenged (blank) and following different periods of exposure to 50 and 100 mg/L teicoplanin (50T and 100T) and vancomycin (50V and 100V). Cultures observed by fluorescence microscopy during the exponential phase (A), and after exposure to 100 mg/L teicoplanin (B) and vancomycin (C) for 24 h. Viable cells are stained green whilst non-viable cells are stained red by the LIVE/DEAD viability kit.
