FIGURE 7.

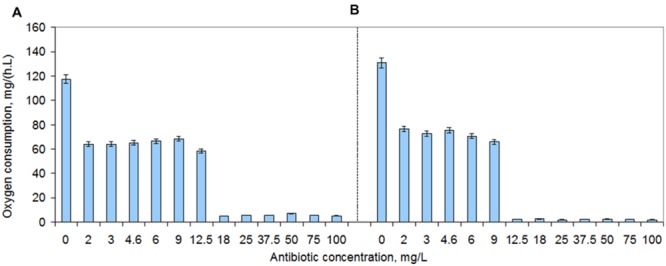
Oxygen consumption rates of S. aureus cells during 2–100 mg/L vancomycin (A) and teicoplanin (B) exposure. The plates were incubated at 37°C and 200 rpm. Error bars represent standard deviation values.

Oxygen consumption rates of S. aureus cells during 2–100 mg/L vancomycin (A) and teicoplanin (B) exposure. The plates were incubated at 37°C and 200 rpm. Error bars represent standard deviation values.