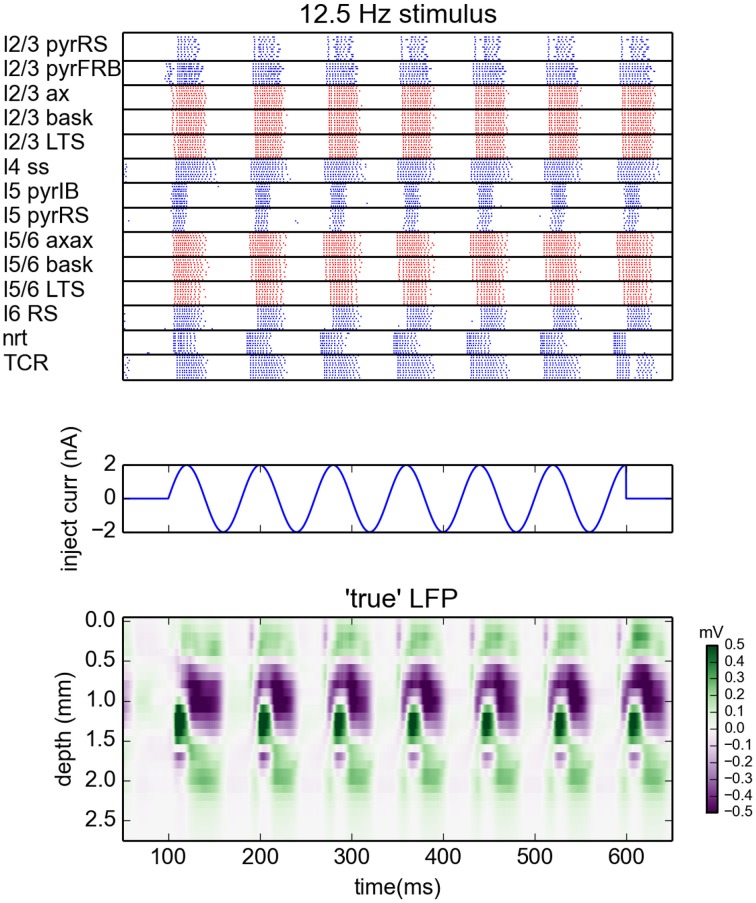
Figure 1.
Generation of virtual LFP data. (Top) Raster plot of the network activity for the simulation with oscillatory current with frequency 12.5 Hz injected to the thalamus for times between 100 and 600 ms (Middle). Blue dots indicate spikes of excitatory neurons, red dots indicate spikes of inhibitory cells. For figure clarity, only activity of 10 randomly selected cells from every population is shown (representative of the populations). Layer 5 and layer 6 pyramidal cells were additionally depolarized by injecting 1 and 0.75 nA currents into their somas, see Traub et al. (2005). (Bottom) Depth-resolved LFP generated by the network model in the same time period.

