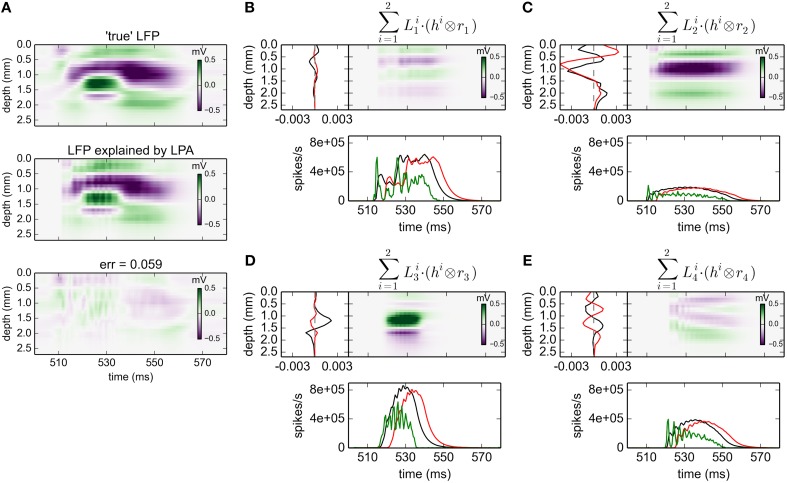
Figure 3.
gLPA-2 decomposition of LFP data. Results from fitting gLPA-2 (K = 2; Equation 4) to LFP data for a time segment where the network is driven by 12.5 Hz oscillatory input in the thalamic relay cells. (A) Comparison of ground-truth LFP (“true” LFP; top) with LPA prediction (middle) with difference shown in bottom panel. (B–E) Estimated contributions from the four laminar components (color plots) with spatial profiles (black:, red:) shown left and temporal profiles [green:rn(t); black:, red:] below. Fitted parameters: Δ1 = 0.48 ms, τ1 = 3.85 ms, Δ2 = 4.80 ms, τ2 = 4.15 ms.

