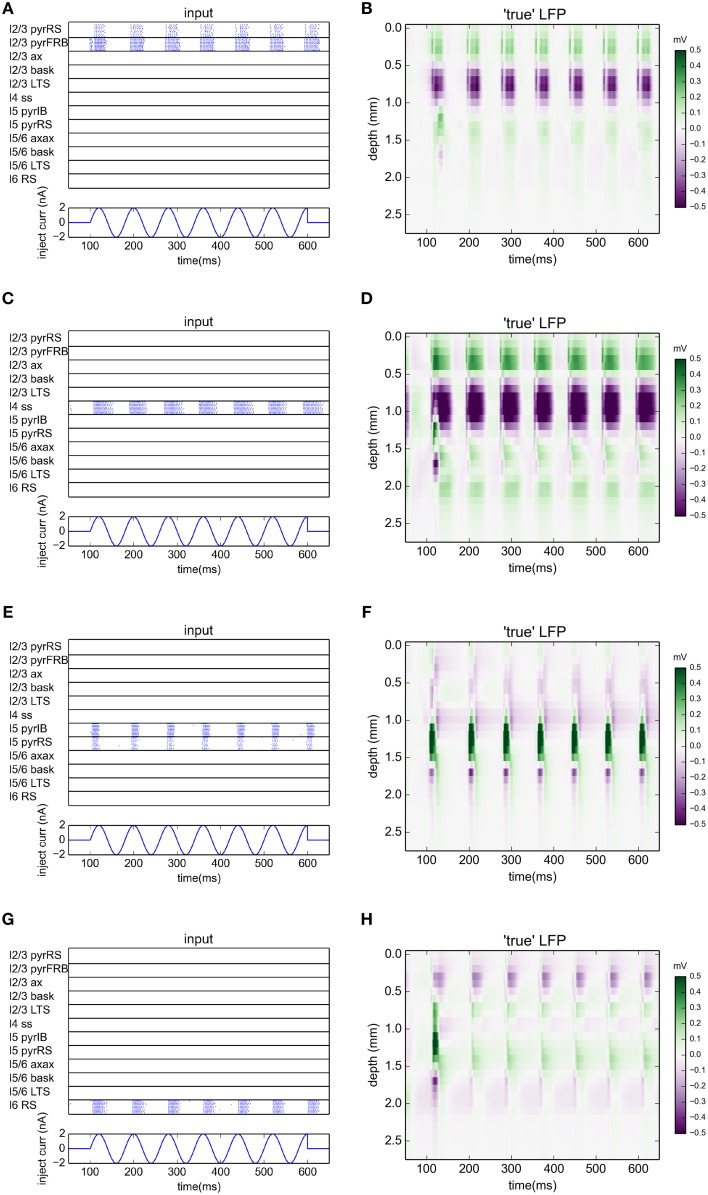
Figure 5.
Ground-truth LFPs activated by single laminar populations. (A,C,E,G) Raster plots of network activity from excitatory populations used in gLPA analysis for simulation with oscillatory current with frequency 12.5 Hz injected to the thalamus for times between 100 and 600 ms. (A) layer 2/3 (n = 1), (B) layer 4 (n = 2), (C) layer 5 (n = 3), (D) layer 6 (n = 4). (B,D,F,H) Corresponding LFP profiles from synaptic activation of an otherwise disconnected network with spikes from individual populations (left column).

