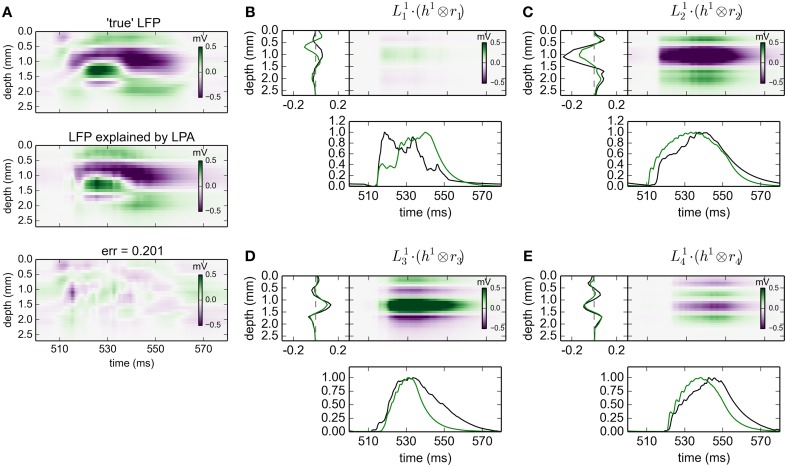
Figure 9.
Population decomposition of LFP signals with MUA-based firing-rate estimates. Results from fitting gLPA-1 (K = 1; Equation 2) to LFP data for a time segment where the network is driven by 12.5 Hz oscillatory input in the thalamic relay cells with MUA-based firing-rate estimates, cf. Figure 8. (A) Comparison of ground-truth LFP (“true” LFP; top) with LPA prediction (middle) with difference shown in bottom panel. (B–E) Estimated contributions from the four laminar components (color plots) with spatial profiles () shown left and temporal profiles [black:] below. Fitted parameters: Δ1 = 0.63 ms, τ1 = 12.65 ms. To facilitate comparison with LPA decomposition results from using ground-truth firing rates depicted in Figure 2 (green spatial and temporal profiles), the time-convolved firing rates Rn(t) are scaled to have a maximum value of one in the depicted time interval, while is scaled correspondingly to keep the product fixed.

