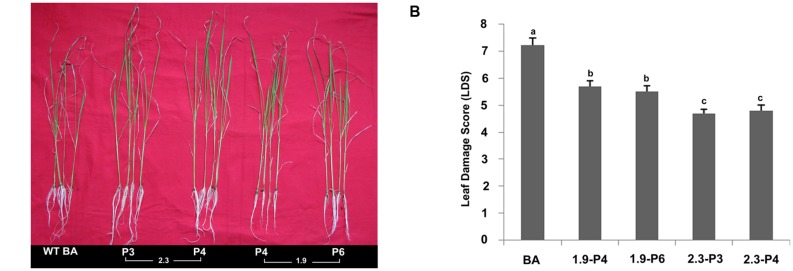
FIGURE 7.
Physiological screening at the T3 stage. (A) Transgenic plants showing better growth under salt stress. BA is the WT plant, 2.3 denotes the transgenic plant transformed with CaMV-OsNHX1-2.3 construct, 1.9 denotes transgenic plant transformed with CaMV-OsNHX1-1.9 construct. (B) Leaf damage score (LDS) at the T3 stage. LDS showed significant reduction in both types of transgenic plants compared to WT BA. The 2.3 plants performed better compared to both 1.9 and WT BA. Each bar represents the mean ± SE (n = 5). Different letters in each graph (a–c) indicate significant differences (P < 0.05, ANOVA and Duncan test).

