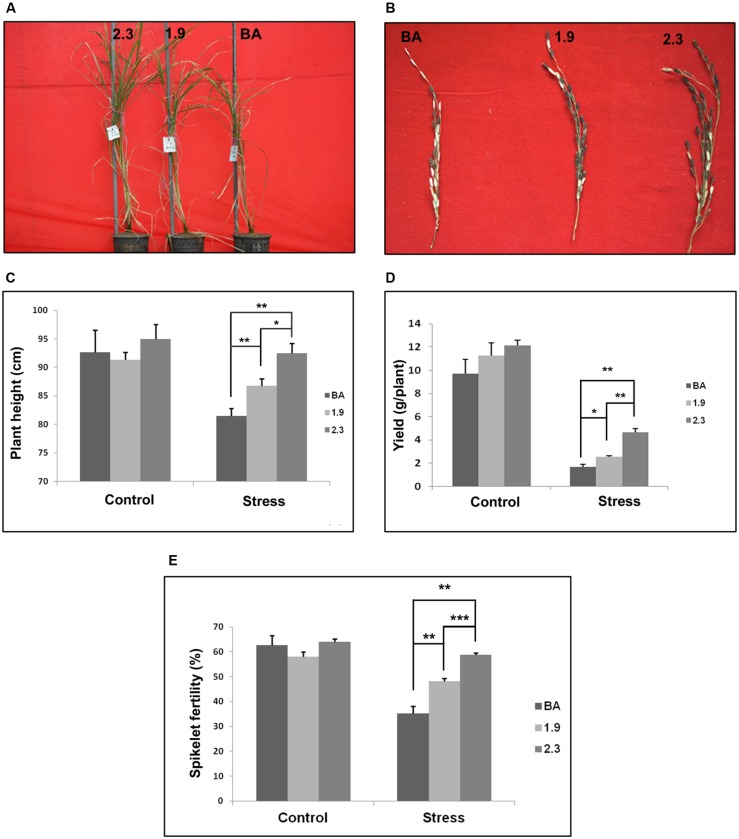
FIGURE 9.
Measure of Agronomic traits of both transgenic lines (1.9 and 2.3) with corresponding WT BA under continuous salinity (NaCl) stress at 6 dS/m. (A) Phenotype of transgenic lines (1.9 and 2.3) and corresponding WT BA under stress condition at maturity. (B) The panicles of transgenic lines and WT BA rice plants collected after salinity stress. Plant Height (C), Yield (D), and Spikelet Fertility (E) of transgenic lines and WT BA rice plants under control and salinity stress. In every case, transgenic lines generated from CaMV_OsNHX1-2.3 performed significantly better than the CaMV_OsNHX1-1.9 transgenic line. ∗Significant difference between wild type and transgenic variety and between the two transgenics at P < 0.05. ∗∗Significant difference between wild type and transgenic variety and between the two transgenics at P < 0.01. ∗∗∗Significant difference between wild type and transgenic variety and between the two transgenics at P < 0.001.

