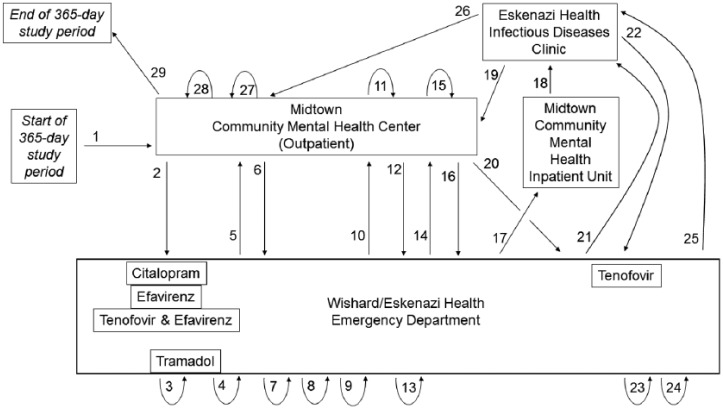
Figure 5.
Case study illustration. Figure shows the complex trajectory of health care encounters (numbered arrows) of one patient during a 1-year period. New prescriptions for pharmacogenetically actionable medications (named in boxes) are linked to visits (proximity of boxes to numbered arrows). Tightly curved arrows are used to illustrate repeat visits to the same health care encounter site. Longer straight or curved arrows link visits between one encounter site and another.

