
Figure 5.
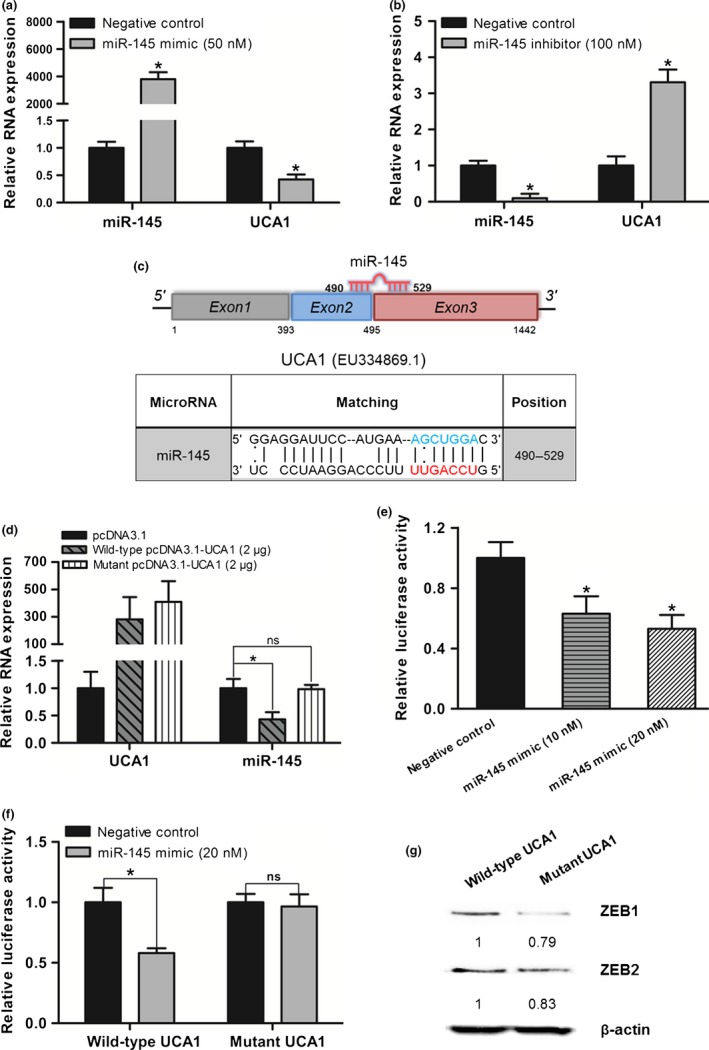
Reciprocal repression of long non‐coding RNA urothelial cancer‐associated 1 (lncRNA‐UCA1) and hsa‐miR‐145 in bladder cancer cells. (a, b) Quantitative PCR analysis of lncRNA‐UCA1 and hsa‐miR‐145 RNA levels in UMUC2 cells transfected with hsa‐miR‐145 mimic and negative control or hsa‐miR‐145 inhibitor and negative control. (c) Schematic representation of the putative binding site of hsa‐miR‐145 on lncRNA‐UCA1. The red nucleotides were the seed sequences of hsa‐miR‐145 and the blue nucleotides (target sites) were deleted in the mutant lncRNA‐UCA1 constructs. (d) Quantitative PCR analysis of lncRNA‐UCA1 and hsa‐miR‐145 RNA levels in UMUC2 cells transfected with wild‐type pcDNA3.1‐UCA1 or mutant pcDNA3.1‐UCA1 at a final concentration of 2 μg. (e) LncRNA‐UCA1 luciferase reporter constructs transfected into UMUC2 cells together with negative control or hsa‐miR‐145 mimic at a final concentration of 10 or 20 nM. (f) Wild‐type lncRNA‐UCA1 luciferase reporter constructs or mutant lncRNA‐UCA1 luciferase reporter constructs transfected into UMUC2 cells together with negative control or hsa‐miR‐145 mimic at a final concentration of 20 nM. (g) Western blot analysis of zinc finger E‐box binding homeobox 1 and 2 (ZEB1/2) protein levels in UMUC2 cells transfected with wild‐type pcDNA3.1‐UCA1 or mutant pcDNA3.1‐UCA1. All data are the averages of at least three independent experiments and are presented as mean ± SD. *P < 0.05. ns, non‐significant, P > 0.05.