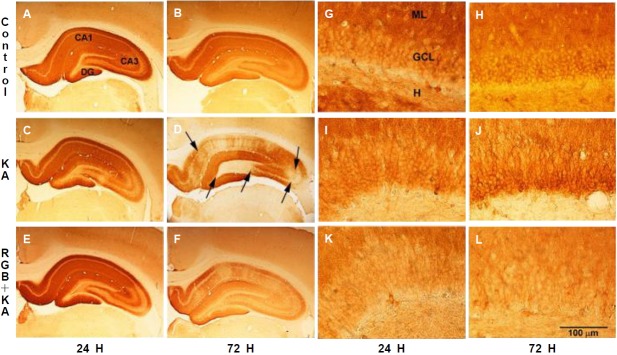
Figure 4.
GluR1 immunohistochemistry in presence and absence of RGB treatment illustrated at two magnifications (20×, 400×). (A, G) GluR1 control immunolabeling was intense and uniform. (B, H) GluR1 expression was stable after RGB treatment in the absence of KA. (C, I) At 24 hr after KA, GluR1 was steady in the CA1 and DG but reduced in the CA3 within areas of cell damage. (D, J) At 72 hr, GluR1 immunolabeling was depleted in the CA1/subiculum and hilus in areas of cell loss but spared in survival regions. (E, K) At 24 hr after RGB+KA treatment, GluR1 protein was stable. (F, L), At 72 hr, GluR1 was reduced in areas of injury, similar to the KA treatment and reduced GluR1 expression was observed within the GCL. Scale=100 μm. RGB, retigabine; KA, kainic acid; GCL, granule cell layer; ML, molecular layer; dentate gyrus.

