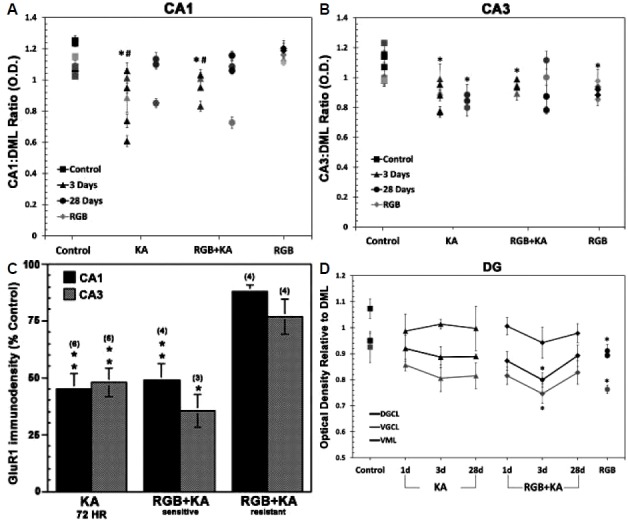
Figure 5.

(A) GluR1 Densitometry measurements of both surviving and damaged regions show marked decreases in both CA1 and CA3 subregions at 3 days. (B) Within subject ratiometric analysis of GluR1 immunodenistometry of the spared regions is illustrated at 3 and 28 days after KA ± RGB treatment. Ratiometric mean averages were significantly decreased throughout the CA1 subfield at 3 days after KA ± RGB. Variable GluR1 expression was observed at 28 days; some had marked depletions that were commiserating with cell loss. Chronic RGB treatment did not alter CA1 expression. (C) GluR1 expression of the CA3 was less variable than CA1; ratiometric mean averages were significantly decreased throughout the CA3 subfield at 3 and 28 days after KA ± RGB. Chronic RGB treatment also reduced GluR1 expression of the CA3 in the absence of KA. (D) Within the GC, GluR1 expression significantly declined after RGB+KA and after chronic RGB treatment in the absence of KA. *p<0.05, One Way ANOVA. GLC, granule cell layer; DML, dorsal molecular layer; KA, kainic acid; RGB, retigabine; DG, dentate gyrus.
