
Figure 7.
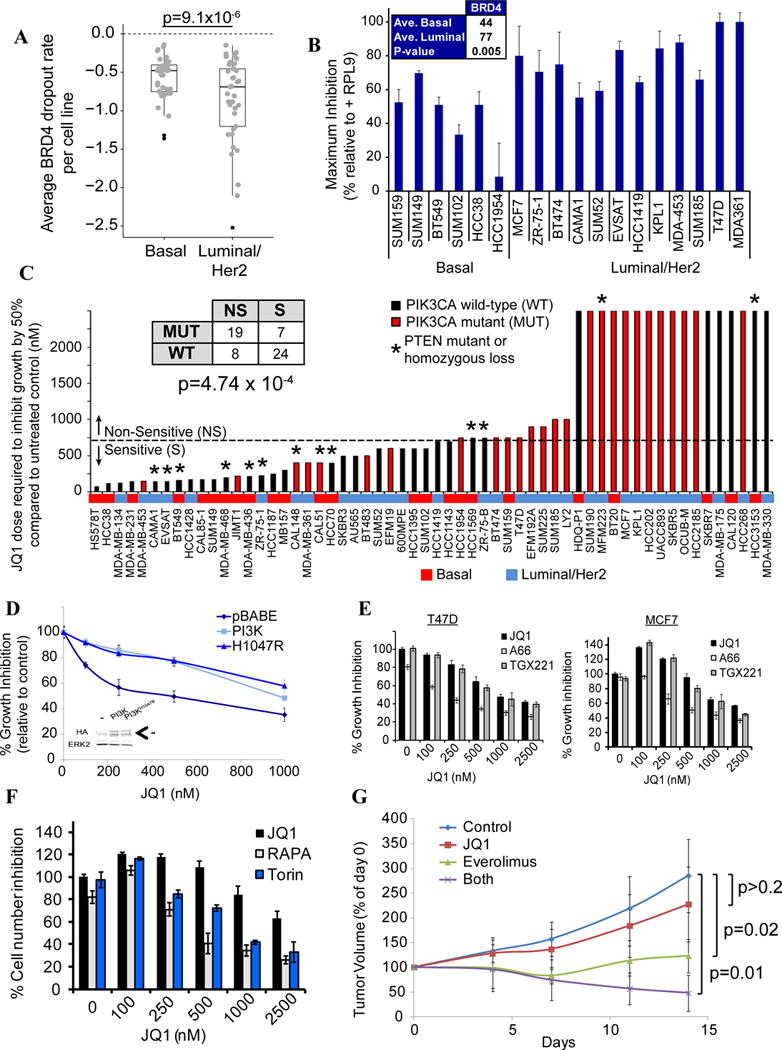
BRD4 is luminal-essential, and PIK3CA mutations cause BET-I resistance. A) Box plot showing BRD4 dropout in each line, by subtype. B) BRD4 siRNAs confirm pooled screen results. Averages are maximum percent inhibition (p=0.005, Student’s t-test). C) Effect of JQ1 on breast cancer lines. Table (inset) shows number of lines, grouped by JQ1 sensitivity (NS=non-sensitive, S=sensitive) and PIK3CA status (mut=mutated, wt=wild-type). Red shading shows lines with PIK3CA mutations. Mutant lines were more likely to be JQ1-resistant (p < 4.7×10⁻⁴, chi-square test). Sensitive lines have GI50 < 750nM. *Lines with PTEN mutation/homozygous deletion. D) WT or mutant PIK3CA (H1047R) render JQ1-sensitive SkBr3 line resistant to JQ1. Inset: Immunoblot showing expression of PIK3CA-p110α. Arrow indicates the specific band. E) JQ1 cooperates with PIK3CA (A66; 1 μM), but not with PIK3CB (TGX; 1μM) inhibitors to decrease MCF7 and T47D proliferation. “0” JQ1 represents A66 or TGX alone. F) JQ1 cooperates with mTOR inhibitors (Rapamycin; 0.5nM, Torin; 50nM) to decrease MCF7 proliferation. “0” represents Rapamycin or Torin alone. G) JQ1 and Everolimus cooperatively inhibit xenograft growth. MCF7 cells (2 × 10⁶) were injected into mammary fat pads of athymic nude mice bearing a slow release estrogen pellet. When tumors were 5×5mm (~21 days), mice were grouped into: 1) control, 2) JQ1 (50mg/kg/day IP), 3) Everolimus (5mg/kg/day by gavage), and 4) JQ1+Everolimus daily. Tumors were measured with calipers every 3–4 days. p value: 1-sided Student’s t-test. Also see Figure S7.