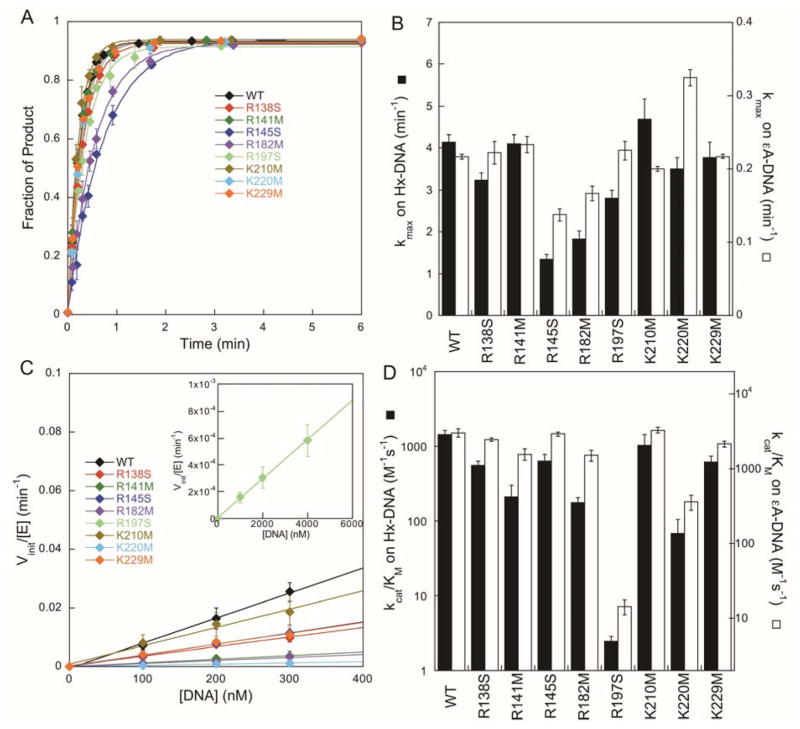
Figure 4.
Excision of Hx by AAG variants. (A) Representative time courses for the single-turnover excision of Hx, fit with single exponentials. (B) Values of kmax for excision of Hx (mean ± SD; n=3) are depicted as solid bars and the open bars show the rate constants for excision of εA from Figure 2C. (C) Determination of kcat/KM values from multiple-turnover glycosylase assays as in Figure 2D. The R197S mutant required higher concentrations of substrate (see inset). (D) Values of kcat/KM are the mean ± SD (n≥3) and are depicted as solid bars. The kcat/KM values for excision of εA are replotted from Figure 2E for comparison (open bars).

