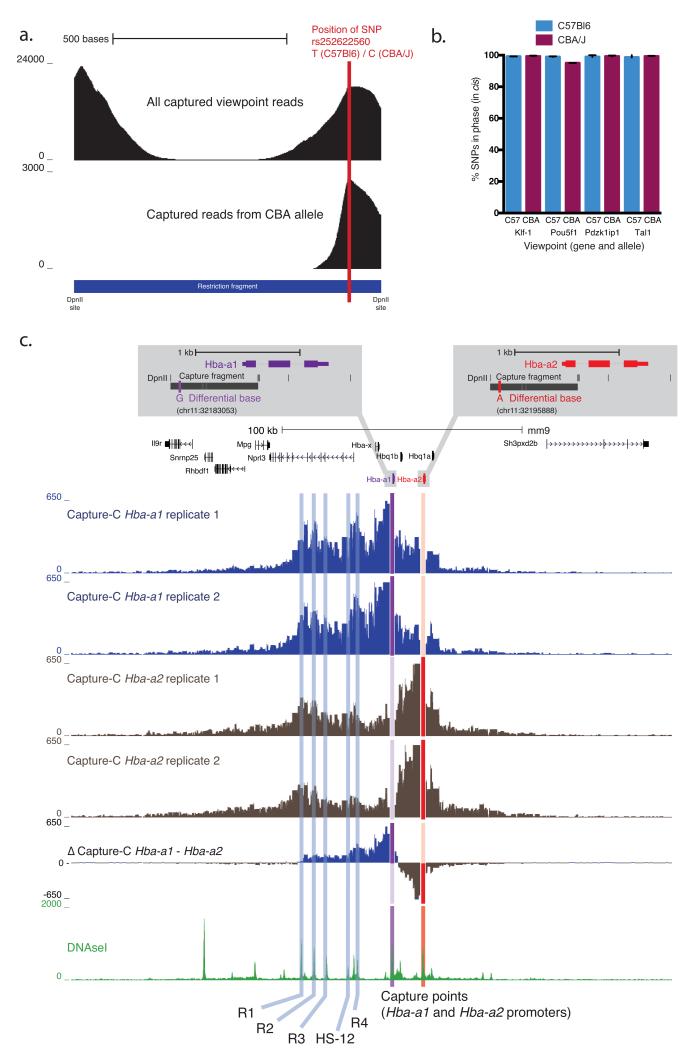
Figure 4. SNP specific interaction profiles.
a. Required positioning of SNP. Density plot of the total reads and CBA SNP allele reads from mapping to the Tal-1 captured restriction fragment (the Tal-1 promoter fragment is shown). SNPs under the captured regions allowed for the generation of allele specific interaction profiles in F1 crosses between C57BL/6 and CBA/J mice (see also Supplementary Figure 22). In the example locus the SNP rs252622560 has been used to separate interactions from the two different alleles.
b. Interactions occur in cis. Graphical representation of the percentage of SNPs in phase in the interacting reads compared with the strain of the captured allele in cis. This demonstrates that the chromosome predominately interacts with itself in cis rather than its sister chromatid.
c. SNP specific NG Capture-C. Using this approach we generated specific interaction profiles for Hba-a1 and Hba-a2 paralogous genes. A single nucleotide difference between the two genes allowed the generation of specific tracks (see inset). Hba-a1 is the more active of the two genes, producing around 70% of the total mRNA. Comparison of the two biological replicates showed that the SNP specific profiles are highly reproducible. The Δ Capture-C track showed the difference of the mean Hba-a1 and Hba-a2 profiles. This revealed that that the Hba-a1 gene preferentially interacts with the enhancers, particularly proximal HS-12 and R4 elements. The Hba-a2 gene interacts much more strongly with the chromatin between the two genes. Interestingly Hba-a2 interacts with the most distal enhancer (R1) to a very similar degree as the Hba-a1 gene.

