
Figure 4.
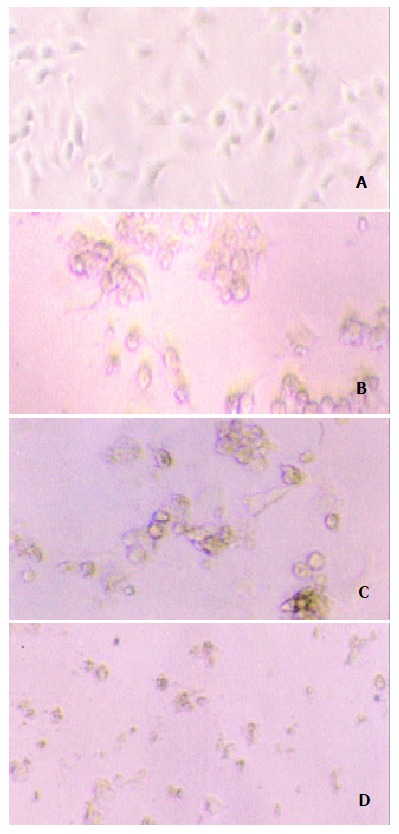
Typical morphological changes in SW1990/TK cells when exposed to GCV (50 μg/ml). A: SW1990/TK cells with-out GCV. B: Two days after adding 50 μg/ml of GCV, cells became round and smaller, losing their normal morphology. C: Four days after adding GCV, cells gathered to balls. D: Five days later, cells clasped into small fragments.