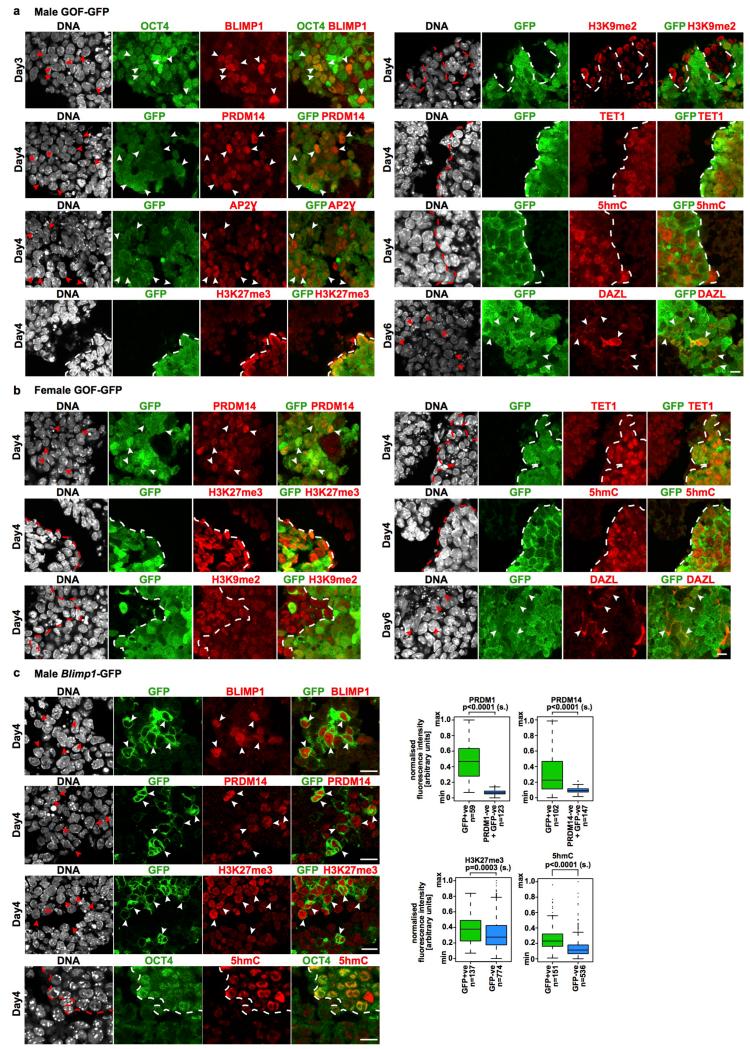
Extended Data Figure 4: Nanog-induced PGCLCs show hallmarks of PGC development.
a-c, IF analysis of PGC markers in GFP+ve cells induced by Nanog from male (a) and female (b) GOF-GFP and male Blimp1-GFP (c) EpiLCs shows expression of BLIMP1, PRDM14, and AP2Ɣ, TET1, enrichment of H3K27me3 and 5hmC and a decrease of H3K9me2 intensity; DAZL is detected in some cells on D6. Arrowheads and dashed lines highlight single or cluster of GFP+ve cells. n=2 biological replicates; scale bar, 10 μm. Quantification in (c) was scale normalised. Two-sided/unpaired t-test: n.s.=not significant; s=significant; n=number of cells analysed. Related to Fig. 1e.

