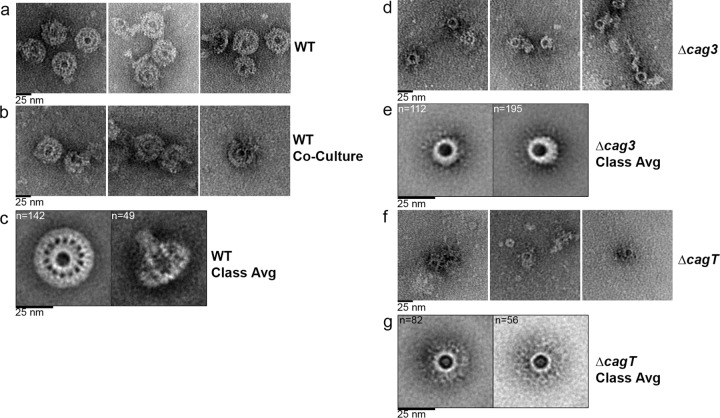
FIG 4 .
Negative-stain EM analysis of the H. pylori cag T4SS core complex. (a) Representative negative-stain images of WT cag T4SS complexes purified from a strain with an intact cag PAI that was engineered to produce HA-CagF. (b) Representative negative-stain images of WT cag T4SS complexes purified from an HA-CagF-producing strain (ΔcagF/HA-CagF) cocultured with AGS cells. (c) Class averages (Class Avg) showing an en face view and a side view of WT complexes. (d) Representative negative-stain images of cag T4SS complexes purified from a Δcag3 strain engineered to produce HA-CagF. (e) Class averages of the cag T4SS complex purified from a Δcag3 strain. (f) Representative negative-stain images of cag T4SS complexes purified from a ΔcagT strain engineered to produce HA-CagF. (g) Class averages of the cag T4SS complex purified from a ΔcagT strain. Numbers of particles used for generating each average are shown in upper left corner of panels. All scale bars represent 25 nm.

