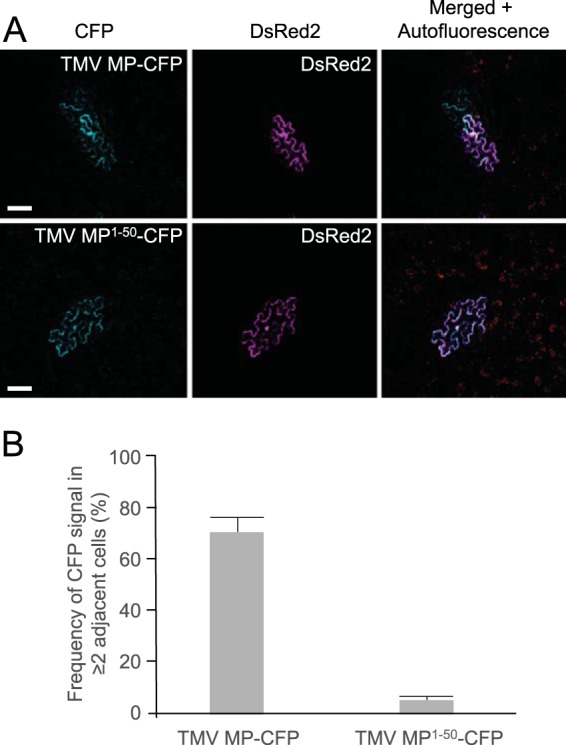
FIG 7 .

Cell-to-cell movement of TMV MP and TMV MP1–50. (A) Representative images for TMV MP and TMV MP1–50 cell-to-cell movement, with free DsRed2 coexpressed to label the initial infiltrated cell. CFP signal is blue; DsRed2 signal is red. Plastid autofluorescence either was filtered out or is shown, as indicated. Cells that contain both CFP and DsRed2 signals represent infiltrated cells, and those that contain only a CFP signal are cells into which movement had occurred. Images are single confocal sections. Scale bars, 50 µm. (B) Cell-to-cell movement was quantified on the basis of examining 50 fields for the presence of CFP in two or more neighboring cells, only one of which expressed both CFP and DsRed2. Results shown for each construct are from three independent experiments. Data are means ± SE.
