Figure 1.

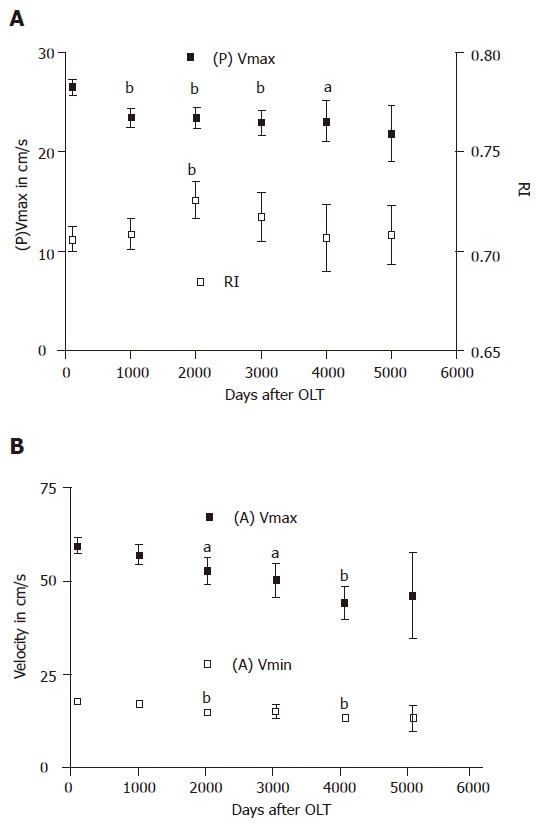
Changes in portal flow velocity and resistance index (A) and arterial velocities (A)Vmax and (A)Vmin after OLT (B) during the course of time after liver transplantation in 260 patients. (aP<0.05; bP<0.01 vs others).

Changes in portal flow velocity and resistance index (A) and arterial velocities (A)Vmax and (A)Vmin after OLT (B) during the course of time after liver transplantation in 260 patients. (aP<0.05; bP<0.01 vs others).