Figure 4.
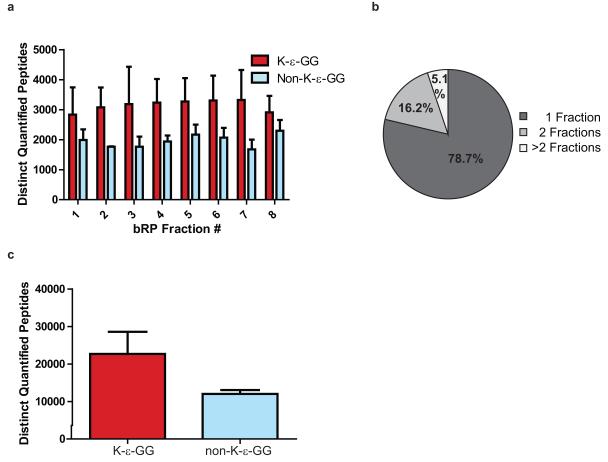
Analysis of K-ε-GG peptide data. A) Bar plot showing the average number of distinct K-ε-GG and non-K-ε-GG peptides identified across 8 bRP fractions for three biological replicates. For this plot, proteins were derived from SILAC-labeled Jurkat cells that were treated with proteasome inhibitor MG-132 or deubiquitinase inhibitor PR-619, or were left untreated6. Approximately 5 mg of protein was input into the K-ε-GG workflow per SILAC state6. B) Pie chart showing the average percentage of K-ε-GG peptides identified in 1, 2, or >2 bRP fractions6. Note that approximately 79% of K-ε-GG peptides are found in only 1 bRP fraction. C) Bar plot showing the average number of distinct K-ε-GG and non-K-ε-GG peptides found in total for the SILAC-based study6.

