
Figure 2. Color Doppler Imaging for Diastolic Function.
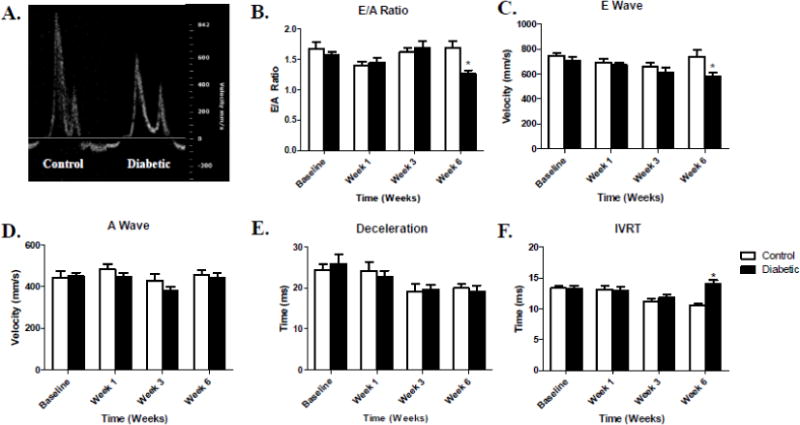
Comparative color Doppler images between control (left) and diabetic (right) mice 6-weeks post-diabetic onset (A). E/A ratio data during type 1 diabetes mellitus progression (B). E wave velocity over time during type 1 diabetes mellitus (C). A wave velocity over time during type 1 diabetes mellitus (D). Deceleration time (E) and Isovolumetric Relaxation Time (IVRT) during the progression of type 1 diabetes mellitus (F). Values are means ± SEM. *P < 0.05 as compared to control at a given time. Open bars = Control animals, n = 8; Closed bars = Diabetic animals, n = 8.