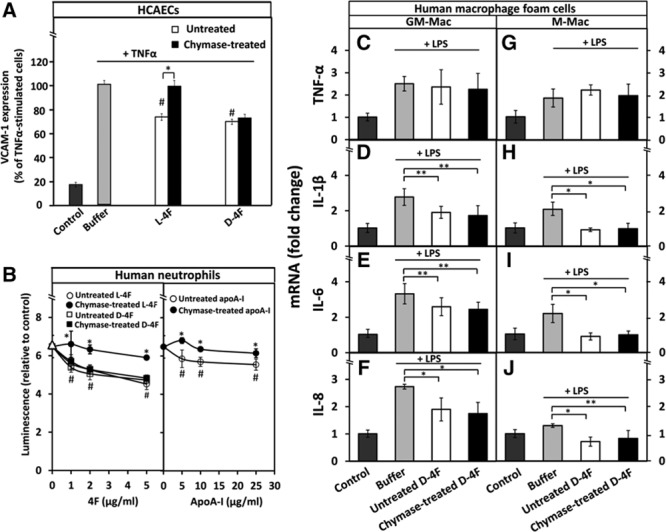
Figure 6.

Chymase treatment does not affect the anti-inflammatory effects of D-4F on human coronary artery endothelial cells (HCAECs), neutrophils, and macrophages. A, HCAECs were preincubated with untreated or chymase-treated L-4F and D-4F (50 μg/mL, each) after which the cells were then activated with tumor necrosis factor-α (TNF-α), as described in Figure 1. Nonactivated cells (control) and TNF-α-activated cells preincubated in only medium (buffer) were used as references. Cell-surface expression of vascular cell adhesion molecule-1 (VCAM-1) protein was determined by flow cytometry. Data represent the means±SD from 3 independent experiments performed in duplicate. *P<0.01; #P<0.01 (untreated L-4F or untreated D-4F vs buffer). B, Superoxide radical production by PMA (phorbol 12-myristate 13-acetate)–activated neutrophils was determined after the cells had been preincubated for 5 min with the indicated concentrations of untreated or chymase-treated L-4F, D-4F, or apolipoprotein A-I (apoA-I). PMA-activated neutrophils preincubated in only medium (buffer) were used as a reference (open triangles). Luminescence emitted by nonactivated neutrophils (control) was set as 1. Data are derived from 2 donors and represent the means±SD from 2 independent experiments, each performed in 3 to 6 wells. *P<0.01 (untreated vs chymase-treated L-4F, and untreated vs chymase-treated apoA-I); #P<0.01 (untreated L-4F, D-4F, or apoA-I vs buffer). C-J, Human monocyte–derived macrophages were differentiated into GM-Mac and M-Mac subtypes and converted into foam cells by incubation with acetyl low-density lipoprotein (LDL). The foam cells were then incubated for 3 h with untreated or chymase-treated D-4F (50 μg/mL, each), washed, and activated for 3 h with lipopolysaccharide (LPS). Nonactivated foam cells (control) and LPS-activated foam cells preincubated in only medium (buffer) served as references. LPS-induced mRNA levels of TNF-α, interleukin (IL)-1β, IL-6, and IL-8 in GM-Mac and M-Mac foam cells were evaluated by quantitative real-time polymerase chain reaction (qRT-PCR) and expressed as fold changes relative to the control cells. Data represent the means±SD from triplicate wells and are representative of 2 independent experiments. *P<0.01; **P<0.05.
