Fig. 2.
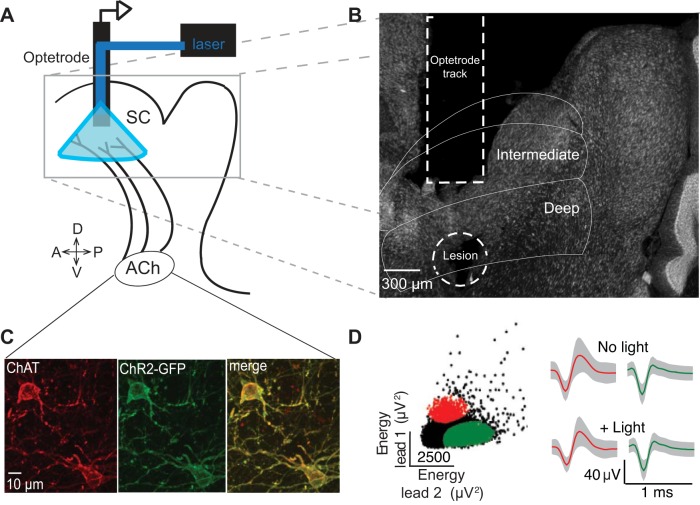
Experimental design and histological confirmation for the stimulation/recording experiments. A: schematic sagittal representation of the experimental design. The optetrode was targeted to the intermediate and deep SC; 473-nm light was delivered to cholinergic terminals expressing ChR2 while extracellular recordings of SC neurons were performed. B: verification of optetrode trajectory through SC and final recording depth. Electrolytic lesion is circled. C: example image from 1 ChAT-Cre/ChR2 mouse consistent with ChR2 expression (green) being limited to ChAT-positive neurons (red) in our ChAT-Cre/ChR2 line. D, left: isolation of the activity of 2 neurons, based on features of the waveforms recorded on each lead, from a representative recording session. Right: for each cluster, the average waveforms on the dominant lead (red, lead 1; green, lead 2) were similar for light-driven spikes (+ Light) and spontaneous spikes (No light). Means ± SD of waveforms are shown.

