Fig. 1.

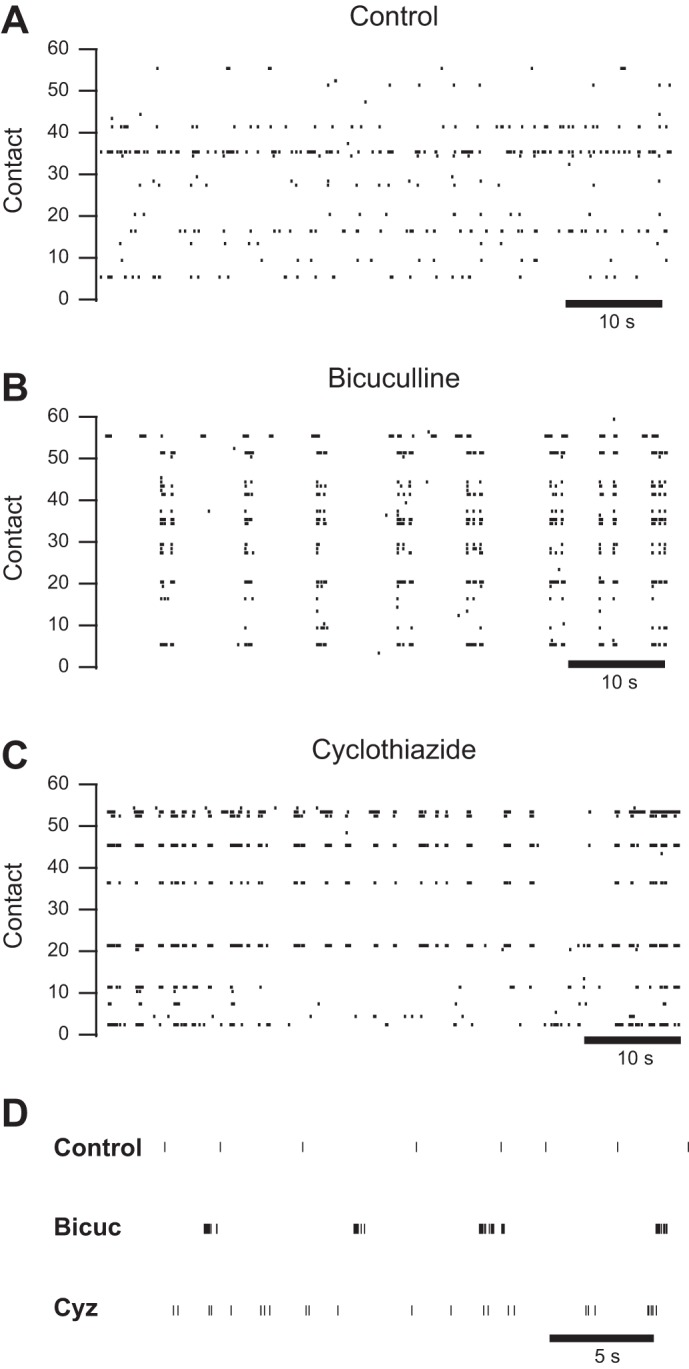
Bicuculline and cyclothiazide increase network activity in different ways. A–C: representative raster plots from multielectrode arrays (MEAs) depicting spontaneous activity in culture medium (A), in culture medium with 50 μM bicuculline added (B; same culture as A) and in culture medium with 10 μM cyclothiazide added (C). D: raster plots of representative channels from the control shown in A, the bicuculline-treated culture (Bicuc) shown in B, and the cyclothiazide-treated culture (Cyz) shown in C at a higher time resolution.
