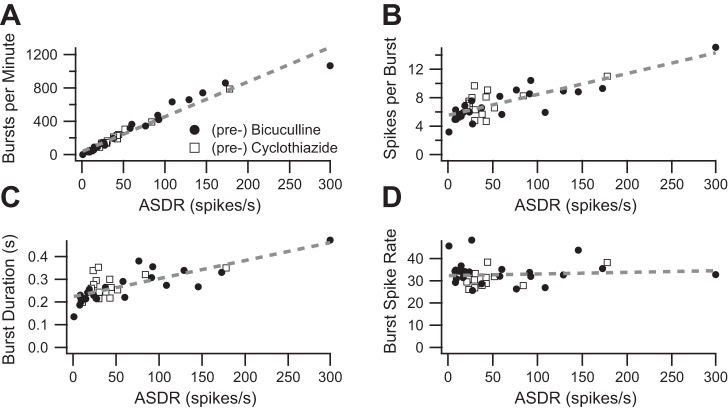
Fig. 3.
Some burst parameters depend on the underlying ASDR. A: baseline average bursts-per-minute values are plotted as a function of the baseline ASDR. The dashed line shows the best-fit line (slope = 4.2, y-intercept = 38.8, r2 = 0.95, P < 0.001). Each data point represents a separate, independent culture. B: baseline average spikes per burst value are plotted as a function of the baseline ASDR. The dashed line shows the best-fit line (slope = 0.028, y-intercept = 5.6, r2 = 0.64, P < 0.001). C: baseline average burst duration values are plotted as a function of the baseline ASDR. The dashed line shows the best fit line (slope = 0.00076, y-intercept = 0.23, r2 = 0.56, P < 0.001). D: baseline average burst spike rate values are plotted as a function of the baseline ASDR. The dashed line shows the best-fit line (slope = 0.013, y-intercept = 31.7, r2 = 0.03, P = 0.6). For all plots, data from experiments testing bicuculline are shown as filled circles and data from experiments testing cyclothiazide are shown as open squares.

