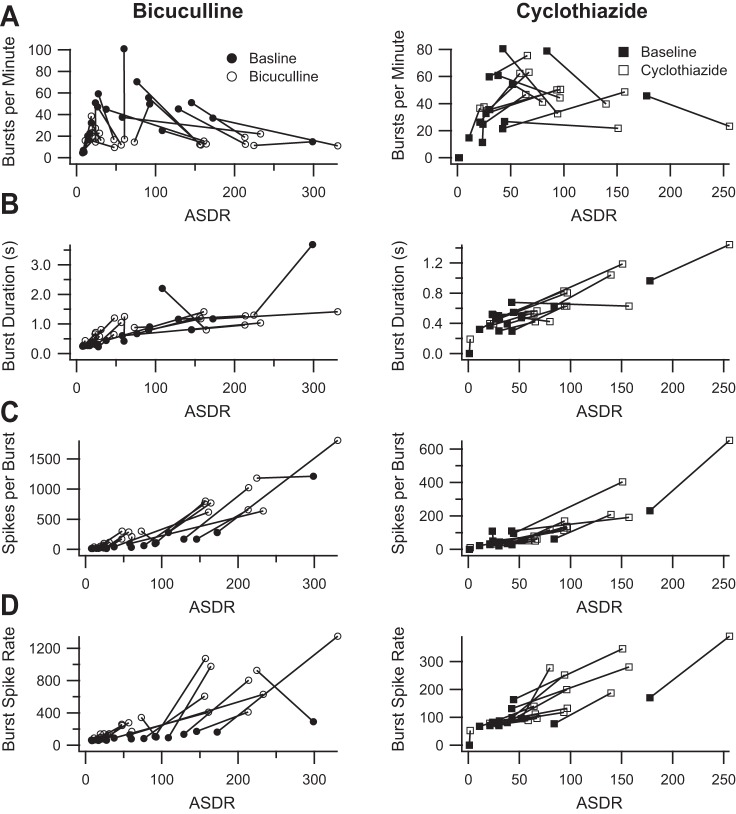
Fig. 5.
Burst parameters measured using the ISIN method. A, left: average number of bursts per minute before (filled circles) and after (open circles) the addition of 50 μM bicuculline (119% baseline, P = 0.6), plotted as a function of the corresponding ASDR; right, corresponding plot before (filled squares) and after (open squares) the addition of 10 μM cyclothiazide (143% baseline, P = 0.06). B, left: average burst duration before (filled circles) and after (open circles) the addition of bicuculline (194% baseline, P = 0.0002), plotted as a function of the corresponding ASDR; right, corresponding plot before (filled squares) and after (open squares) the addition of cyclothiazide (135%, P = 0.002). C, left: average number of spikes per bursts before (filled circles) and after (open circles) the addition of bicuculline (618% baseline, P = 0.000005), plotted as a function of the corresponding ASDR; right, corresponding plot before (filled squares) and after (open squares) the addition of cyclothiazide (260% baseline, P = 0.0006). D, left: average burst spike rate before (filled circles) and after (open circles) the addition of bicuculline (398% baseline, P = 0.000006), plotted as a function of the corresponding ASDR; right, corresponding plot before (filled squares) and after (open squares) the addition of cyclothiazide (186% baseline, P = 0.00006). Statistics were calculated without regard for ASDR, analogous to Fig. 2.

