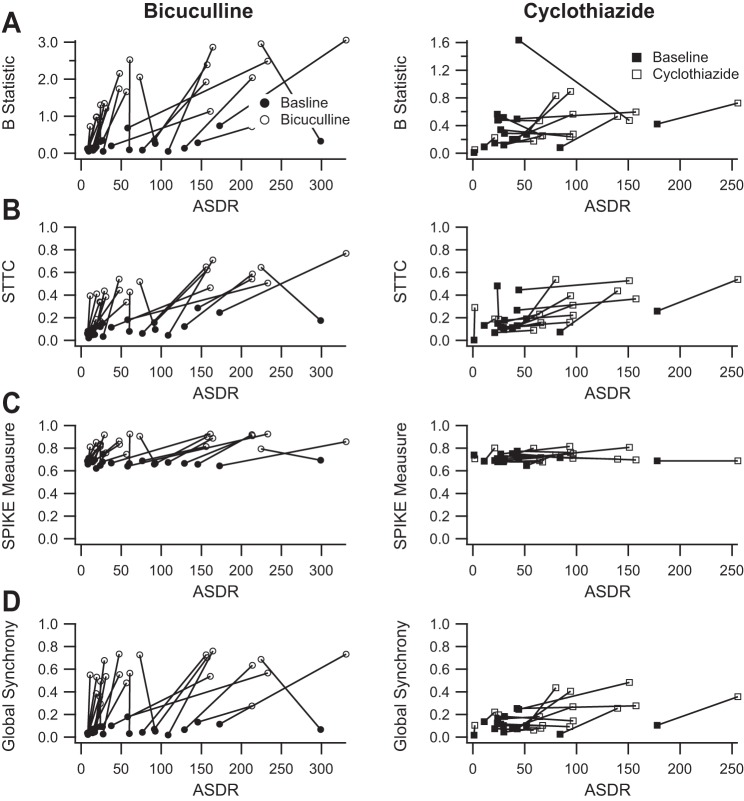
Fig. 9.
The SPIKE-distance and global synchrony measures perform better than the B statistic and the spike time tiling coefficient (STTC) measures. A: the B statistic is plotted as a function of ASDR before (filled circles) and after (open circles) the addition of 50 μM bicuculline (left) and before (filled squares) and after (open squares) the addition of 10 μM cyclothiazide (right). Bicuculline clearly increases synchrony as measured with the B statistic (1.7 ± 0.16 vs. 0.22 ± 0.040; P < 0.001, paired t-test), whereas cyclothiazide does not (0.44 ± 0.061 vs. 0.37 ± 0.095; P > 0.05, paired t-test). However, the values should range between 0 and 1. Values outside of that range call the measurement into question. B: the STTC is plotted as a function of ASDR before (filled circles) and after (open circles) the addition of 50 μM bicuculline (left) and before (filled squares) and after (open squares) the addition of 10 μM cyclothiazide (right). Bicuculline appears to increase the STTC (0.47 ± 0.033 vs. 0.11 ± 0.015; P < 0.001, paired t-test). However, the apparent dependence of the STTC on the ASDR at left (r2 = 0.35, P = 0.004) and the variability of the baseline responses at right render the STTC more difficult to interpret. C: the SPIKE-distance measure is plotted as a function of ASDR before (filled circles) and after (open circles) the addition of 50 μM bicuculline (left) and before (filled squares) and after (open squares) the addition of 10 μM cyclothiazide (right). Bicuculline clearly increases synchrony as measured with the SPIKE-distance measure (0.86 ± 0.012 vs. 0.67 ± 0.0057; P < 0.001, paired t-test), whereas cyclothiazide does not (0.73 ± 0.012 vs. 0.71 ± 0.0083; P = 0.09, paired t-test). D: the global phase synchrony measure is plotted as a function of ASDR before (filled circles) and after (open circles) the addition of 50 μM bicuculline (left) and before (filled squares) and after (open squares) the addition of 10 μM cyclothiazide (right). Again, bicuculline clearly increases synchrony as measured with the global phase synchrony index (0.57 ± 0.031 vs. 0.065 ± 0.0086; P < 0.001, paired t-test). The global phase synchrony index also detects an effect of cyclothiazide (0.23 ± 0.034 vs. 0.11 ± 0.017; P < 0.003, paired t-test). In addition, the global phase synchrony measure has a lower baseline and a larger increase in the presence of bicuculline, suggesting a larger dynamic range than the SPIKE-distance measure.

