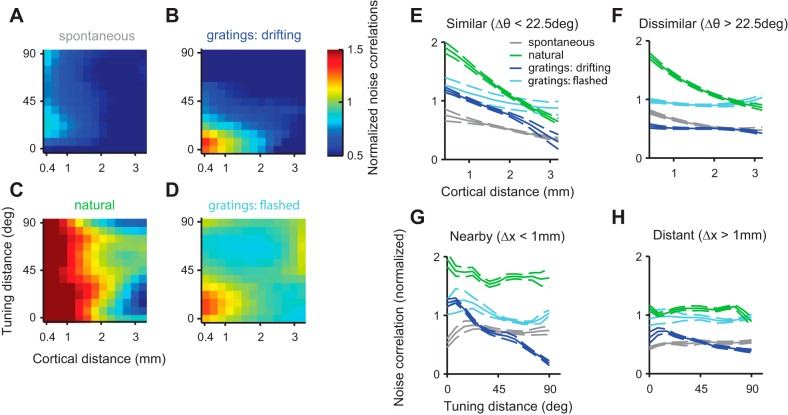
Fig. 4.
Effect of cortical distance and tuning distance on noise correlations. A–D: dependence of noise correlations on cortical distance and tuning distance (difference in preferred orientation between the pair). Each panel corresponds to a stimulus type, and each point represents the average noise correlation of multiple pairs divided by the noise correlation predicted from the pairs' firing rates only (Smith and Kohn 2008). E and F: dependence of noise correlations on distance in space for similarly (E) and dissimilarly (F) tuned cells. G and H: dependence of noise correlations on tuning distance for nearby (G) and distant (H) cell pairs.

