Fig. 2.
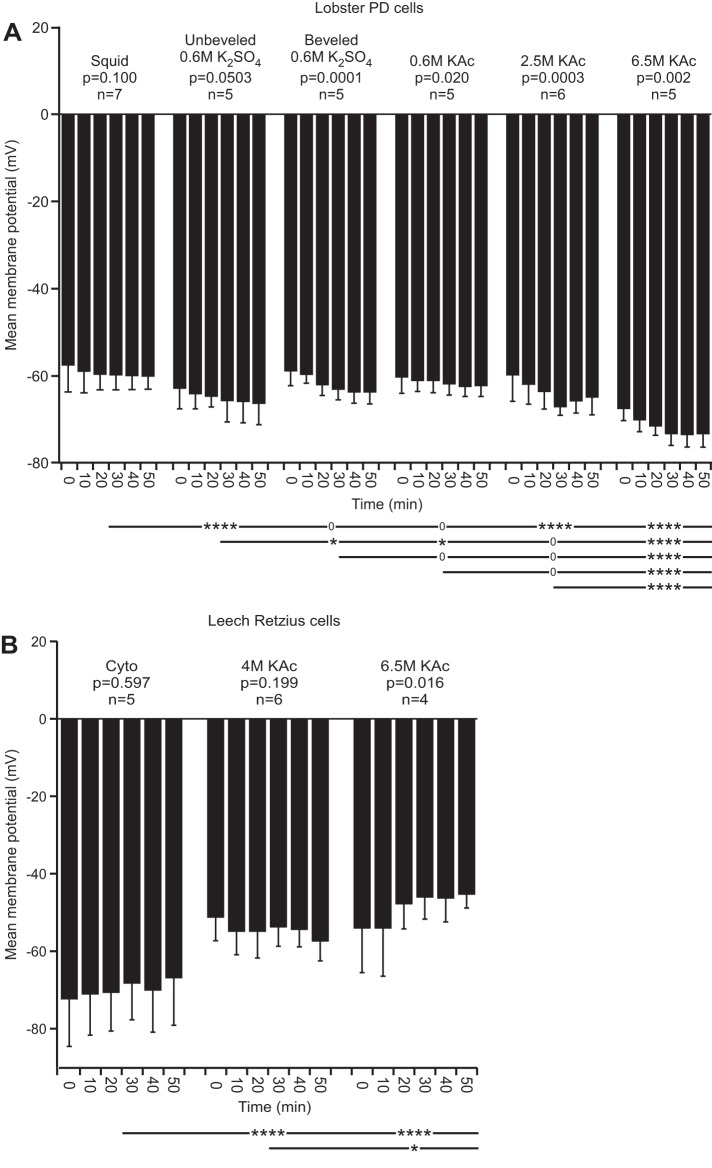
Lobster [in picrotoxin (PTX)-TTX saline] and leech Vm. For this and all figures, all error bars are SD. The P values above the columns show whether change over time occurred within the fill type (repeated-measures, 1-way ANOVA; see Figs. 3–5 and 10–13 for the same convention used). The lines and asterisks below the columns denote whether the means of all of the data of each fill differed from the means of all of the data of the other fills (that is, each fill's data at all time points were grouped together and then compared with the similarly grouped data of the other fills; see materials and methods) using an ANOVA with a Tukey's all-pairs post hoc comparison (0, P > 0.05; *P = 0.05 to >0.01; **P = 0.01 to >0.001; ***P = 0.001 to >0.0001; ****P ≤ 0.0001). Each horizontal line compares the data at the line's left end with the other data sets. For example, the uppermost line shows that the squid data differ from the unbeveled 0.6 M K2SO4 data at P < 0.0001, do not differ from the beveled 0.6 M K2SO4 or 0.6 M KAc data, and differ from the 2.5 and 6.5 M KAc at P < 0.0001. The next line similarly compares the unbeveled 0.6 M K2SO4 data with the beveled 0.6 M K2SO4, 0.6 M KAc, 2.5 M KAc, and 6.5 M KAc data (see Figs. 3–5 and 10–13 for the same convention used, and see Figs. 3–5, as the same n for each column is used). A: lobster pyloric dilator (PD) neuron Vm was constant over time with squid and unbeveled 0.6 M K2SO4 fills but changed with time with all other fills. The squid fill data differed from the unbeveled 0.6 M K2SO4, 2.5 M KAc, and 6.5 M KAc data at P < 0.0001. The 6.5-M KAc fill differed at P < 0.0001 from all other fills. B: leech Vm was constant over time with cyto and 4 M KAc fills but changed significantly with 6.5 M KAc. The cyto fill differed from the 2 high molarity fills.

