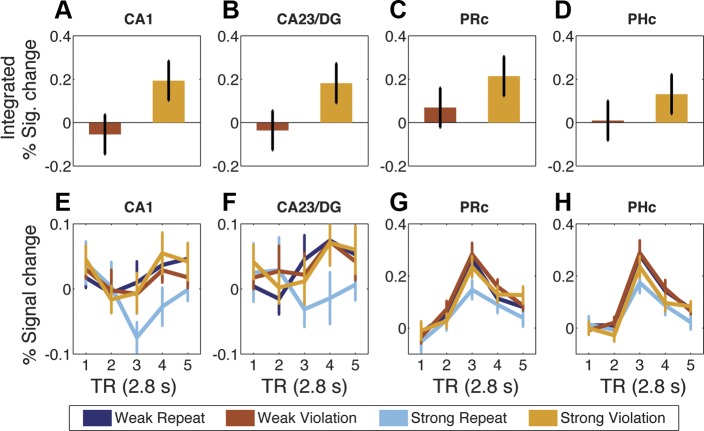
Fig. 4.
Violation effects in functional ROIs. A–D: difference plots of weak prediction violation (Weak Violation minus Weak Repeat) and strong prediction violation (Strong Violation minus Strong Repeat) quartets. Bars were calculated from integrated percent signal change (TRs 3–5) in CA1 (A), CA23/DG (B), PRc (C), and PHc (D). Values are means ± SE of error term from interaction. E–H: percent signal change time courses for CA1 (E), CA23/DG (F), PRc (G), and PHc (H). Values are means ± SE of subjects. Functional ROIs were created from the contrast of 1-back trials > baseline and thresholded at t > 0.675.

