Fig. 5.
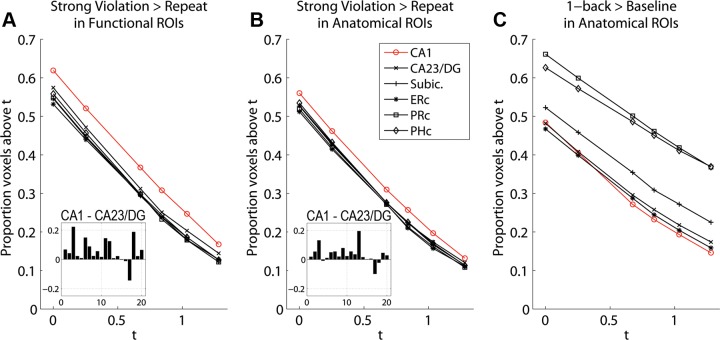
Proportions of voxels above threshold. A: Violation > Repeat contrast in functional ROIs, for thresholds t = 0.000, 0.253, 0.675, 0.841, 1.036, and 1.282. Inset: difference of CA1 minus CA23/DG for each subject at t = 0.675. B: Violation > Repeated contrast in anatomical ROIs, for same thresholds as in A. Inset: difference of CA1 minus CA23/DG for each subject at t = 0.675. C: 1-back > baseline contrast in anatomical ROIs. ERc, entorhinal cortex; Subic, subiculum.

