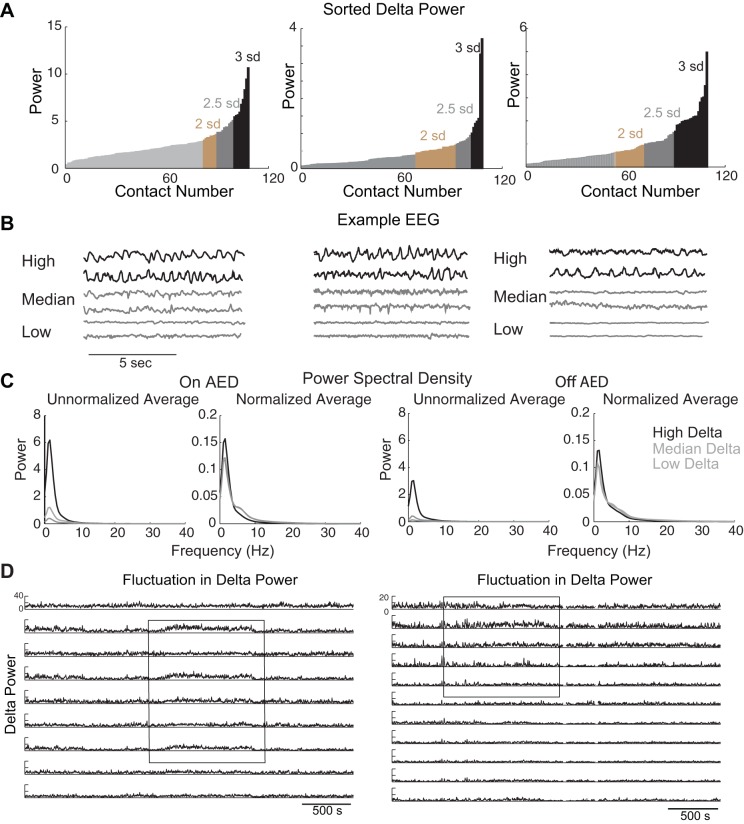
Fig. 2.
The nature of delta activity in icEEG recordings. A: distribution of delta power. For each patient, and each recording site, the delta power over 1 h of recording was estimated. The delta power at each site was ranked and plotted from lowest to highest value. Sites showing higher delta power (>3 SDs) than the mean delta power are highlighted in black, with >2.5 SDs in gray and >2 SDs in brown. Some recording sites have excessively high delta power (black bins). B: EEG traces. Representative EEG traces with high (black) and median and low (gray) delta power from 3 patients are shown here. Sites with high delta power show EEG with rhythmic delta. Drugs were still being tapered in patients 1 and 2 but had been completely withdrawn in patient 3. C: comparison of the power spectral density for 12 recording sites (in all 18 subjects) with the highest, median (n = 18), and lowest (n = 18) delta power, before (left) and after (right) AEDs had been tapered off. Even after normalizing for total power in each hour-long recording, the recording sites with high delta power contained significantly (n = 18 subjects, P < 0.01, paired t-test) more delta power than recording sites with low delta power. D: persistence of high delta. Each of the recording sites shown here had high delta power, but even in these sites delta power could fluctuate between high and low delta power. Note that only some recording sites show changes in delta power, i.e., some of the contacts are relatively flat in their delta power levels. Left: from the same patient as in B, left, and Fig. 1A. Right: from a different patient.

