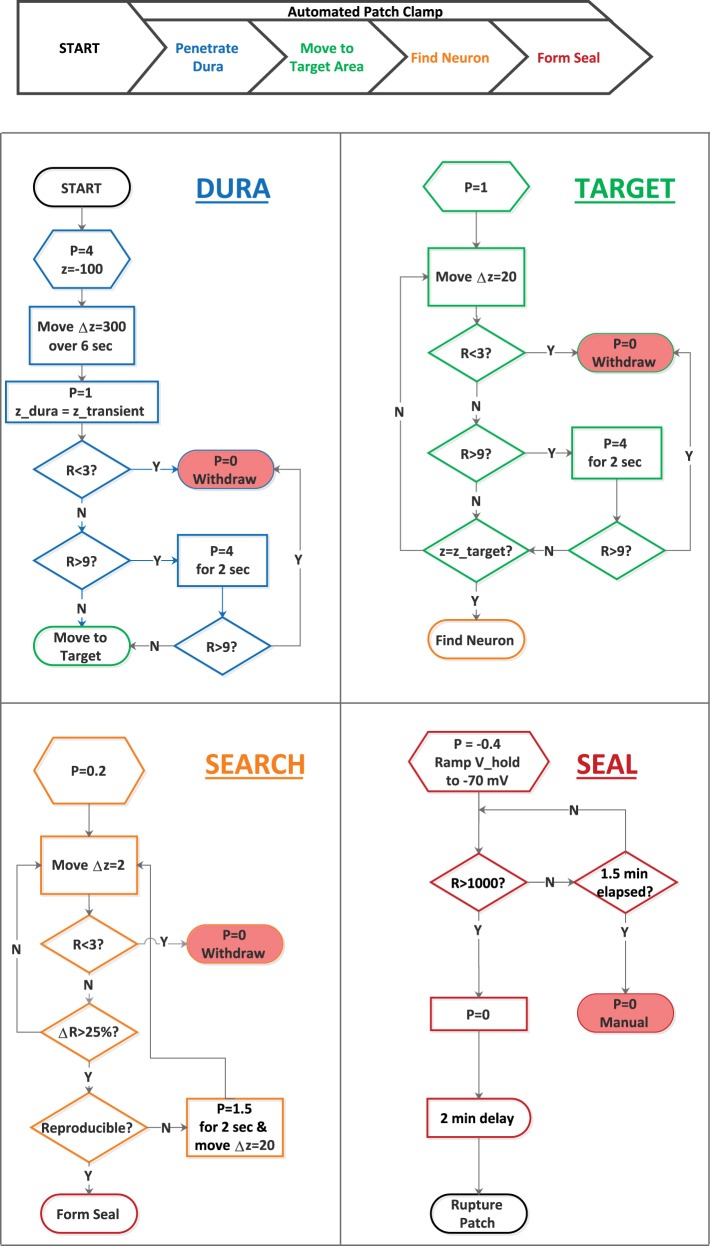
Fig. 5.
Flow control of the automated patching process. The flowchart diagrams illustrate the steps associated with penetrating the dura, moving to the target brain region, searching for a neuron, and forming a gigaohm seal. The symbols P, R, and Δz refer to the pressure applied to the electrode (in psi), the measured tip resistance (in megohms), and incremental movement down into the brain (in micrometers), respectively. The flowchart shapes have their standard meanings: oval, start or stop point in a process; rectangle, an operation; hexagram, a preparatory step; diamond, a decision point; rectangle with a curved right side, a fixed delay. Note that the patching process can be terminated by a sudden drop in resistance, indicative of a broken tip; a large increase in resistance (except when attempting to form a seal), indicative of a clogged tip; and formation of or failure to form a gigaohm seal. The position of the dura, z_dura, is identified by the position of the transient, z_transient, as the electrode crosses it. The position at which to begin searching for a neuron is designated z_target. Y, yes; N, no; V_hold, voltage-clamp holding potential.

