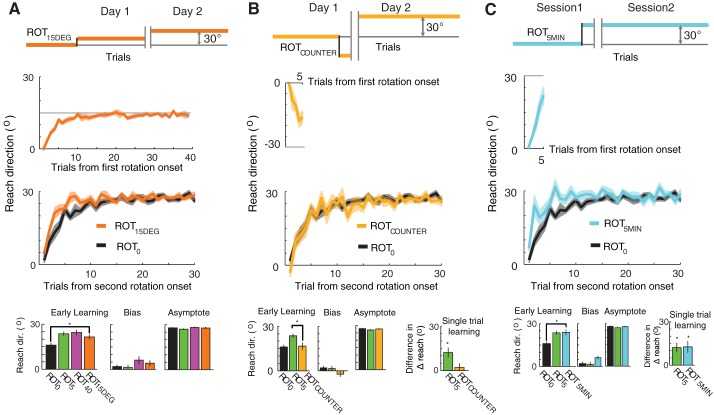
Fig. 3.
Results for additional groups. A, top: perturbation schedule for ROT15DEG. Middle 2 panels: initial adaptation and readaptation. A, bottom: early learning (day 2, mean of trials 2–6), initial bias (day 2, trial 1), and asymptotic performance (day 2, mean of trials 26–65). B and C: same as in A but for groups ROTCOUNTER and ROT5MIN, respectively. Relevant principal groups are included for comparison. All error bars and shaded regions indicate ± 1 SE across subjects. *P < 0.05.

