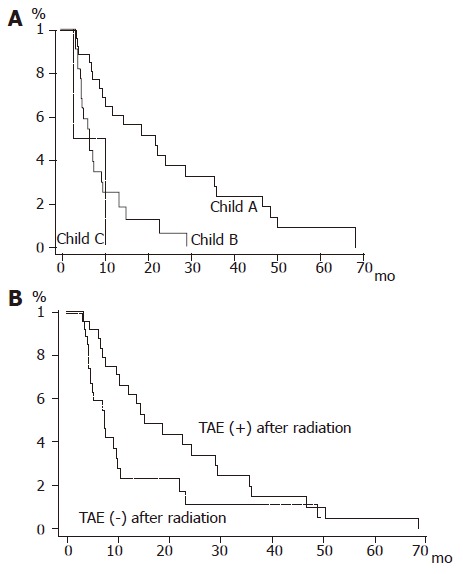
Figure 4.

A: Survival curves according to Child classification. Solid line: Child A; bold line: Child B; dashed line: Child C; B: Survival curves for the patient group with and without post-radiation TAE. Solid line: post-radiation TAE (+); dashed line: post-radiation TAE (–).
