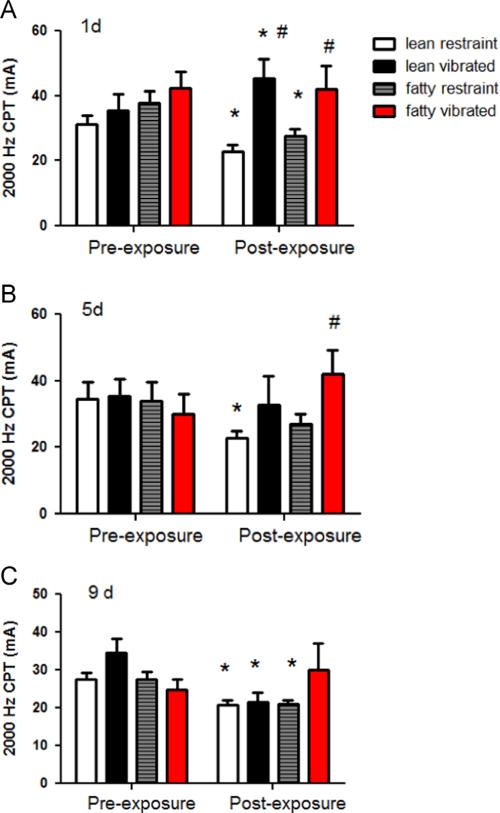
Fig. 1.
These graphs show the current perception thresholds at 2000 Hz before and after. vibration exposures on days 1 (A), 5 (B) and 9 (C) of the experiment. On day 1, both lean and obese control rats showed an increased sensitivity to stimulation at 2000 Hz (the CPT was reduced as compared to pre-exposure values, * different than pre-exposure values, p<0.05). Lean rats exposed to vibration displayed a reduction in sensitivity to the 2000 Hz stimulus (i.e., an increase in the CPT value) after exposure to vibration, and obese rats did not display any significant changes pre- to post-exposure on day 1 of the experiment. However, both lean and obese rats exposed to vibration had higher CPTs as compared to control rats post-vibration exposure (# different than post-exposure controls, p<0.05). On day 5 of the experiment, lean rats exposed to vibration showed a reduction in the CPT pre- to post-vibration exposure, and obese rats showed an increased CPT after vibration exposure as compared to obese controls. On day 9 of the study, lean control, lean vibrated and obese control rats displayed a lower post-exposure CPT than pre-exposure CPT. However, obese rats did not display any significant changes in CPT.

