Fig. 3.
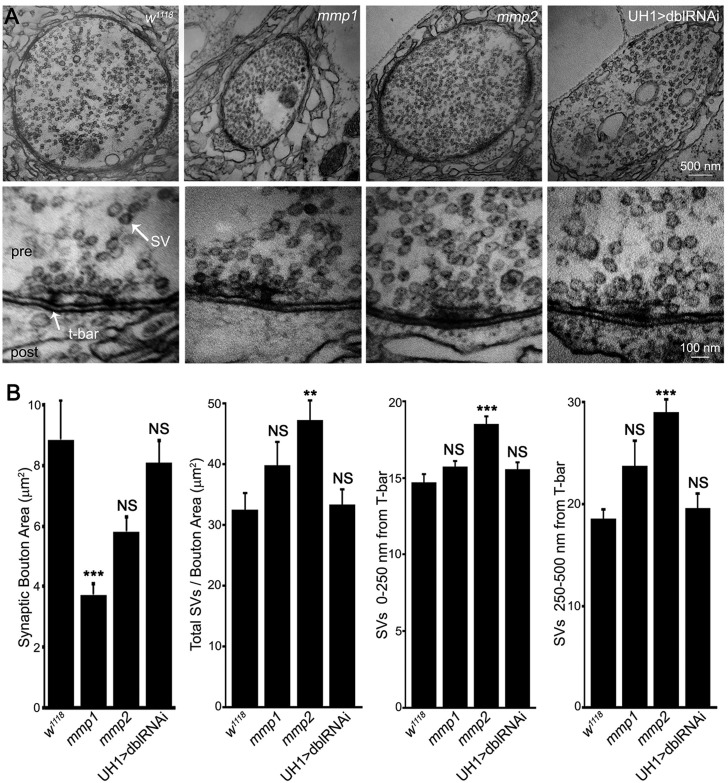
Mmp1 and Mmp2 modulate synaptic ultrastructural development. (A) Transmission electron microscopy (TEM) images of NMJ boutons (low magnification, top) and presynaptic active zones (high magnification, bottom) in control (w1118), mmp1Q112*/Q273*, mmp2ss218/Df and UH1>mmp1+2RNAi (dblRNAi). (B) Quantification of ultrastructural bouton area, synaptic vesicle (SV) number/bouton area, and SV number within 0-250 and 250-500 nm of active zone T-bars. See Table S1B for data values and sample sizes. See Figs S3-S5 for analyses of pre- and postsynaptic molecular components. **P<0.01, ***P<0.001; NS, not significant.

