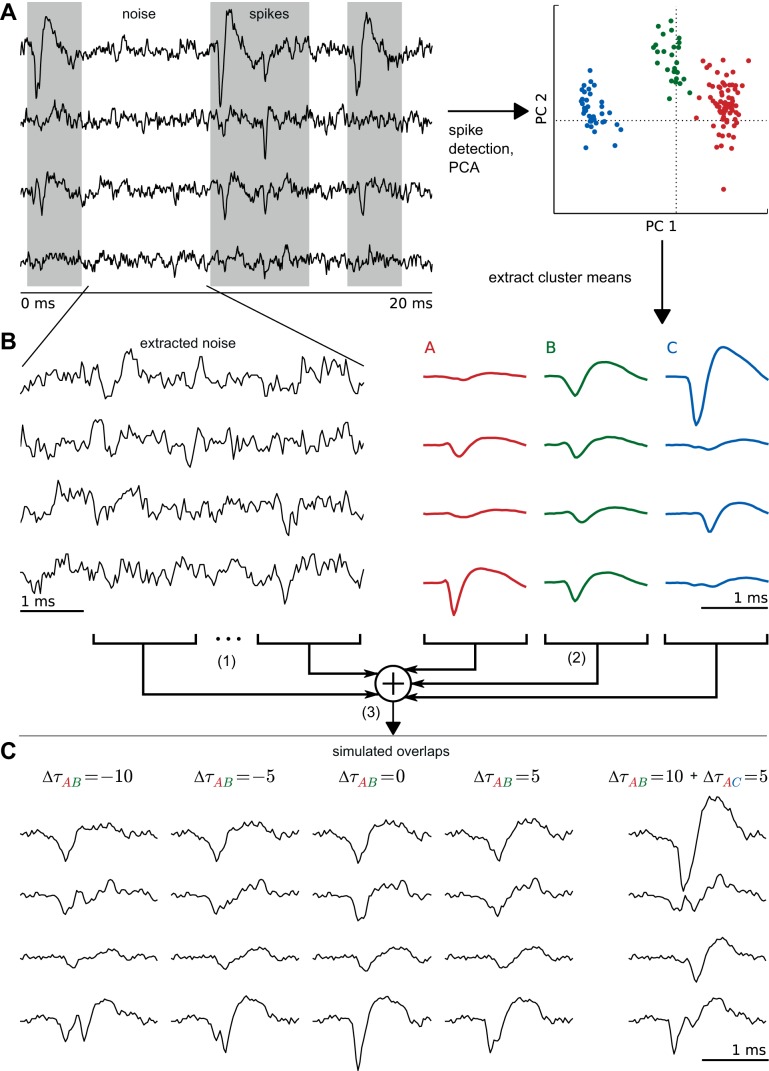
Fig. 4.
Simulation of overlapping spikes. A: data were recorded with a tetrode in monkey prefrontal cortex and sorted with a standard spike sorting approach using the following steps: spike detection, spike alignment (not shown), prewhitening of spikes (not shown), PCA, expectation maximization clustering. The cluster means are used as templates for the corresponding neuron. B: simulation of overlaps consisted of 3 steps: 1) Cutting of a small piece of recorded data where no spikes were detected (= noise). 2) Selection of 2 or more random templates from the sorting of corresponding data. Random subsample shift for each template. 3) Linear superposition of noise and templates. C: examples of overlaps at different shifts (Δτ). Four overlaps of 2 spikes and 1 overlap of 3 spikes are shown. Δτ values are given in samples; sampling rate is 32,000 Hz. The examples show integer values for Δτ, but subsample shifts were also produced by upsampling, shifting, and successive downsampling of the respective waveforms.

