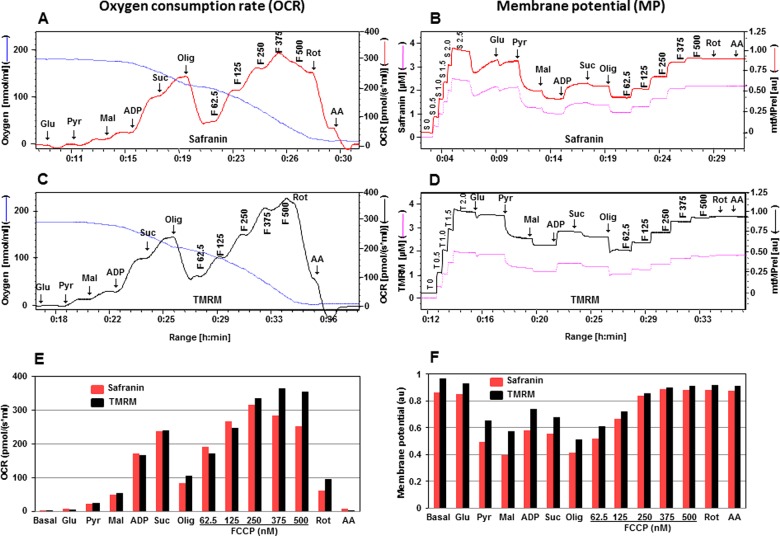
Figure 1. Comparison of two fluorescent dyes, safranin and TMRM, during simultaneous measurement of OCR and mtMP in isolated rat cortical mitochondria (200 μg of protein).
Simultaneous assessment of OCR is depicted in A, C, E and mtMP in B, D, F with substrates glutamate (Glu: 10 mM), pyruvate (Pyr: 10 mM), malate (Mal: 2 mM), ADP (2 mM), succinate (Succ: 10 mM), oligomycin (Olig, 1 μM), FCCP (F: 62.5–500.0 nM), rotenone (Rot: 1 μM) and antimycin A (AA: 1 μM). Oxygen concentration levels (nmol/ml) are illustrated in A and C (blue thin lines; left axes) and OCR in [pmol/(s·ml)] in right axes with safranin (thick red line) and TMRM (thick black line) respectively. Fluorescent signal levels of mtMP with safranin and TMRM [(μM), purple thin lines; left axes] and relative signals, mtMP (au) in right axes with safranin (thick red line) and TMRM (thick black line) are in B and D respectively. Levels of OCR and mtMP are also represented in bar charts in E and F with safranin (red) and TMRM (black) respectively.

