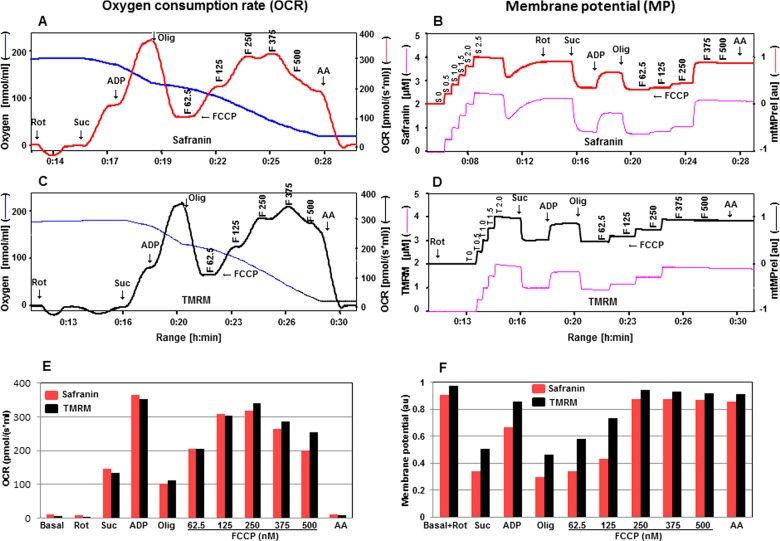
Figure 5. Assessment of OCR and mtMP in the presence of safranin or TMRM with succinate.
Simultaneous assessment of OCR is depicted in A, C, E and mtMP in B, D, F with mitochondrial substrates and inhibitors (Rot: 1 μM; Suc: 10 mM; ADP: 2 mM; Olig: 1 μM; F: 62.5–500.0 nM; AA: 1 μM). Oxygen concentration levels (nmol/ml) are illustrated in A and C (blue thin lines; left axes) and OCR in [pmol/(s·ml)] in right axes with safranin (thick red line) and TMRM (thick black line) respectively. Fluorescent signal levels of mtMP with safranin and TMRM [(μM), purple thin lines; left axes] and relative signals, mtMP (au) in right axes with safranin (thick red line) and TMRM (thick black line) are in B and D respectively. Levels of OCR and mtMP are also represented in bar charts in E and F with safranin (red) and TMRM (black) respectively.

