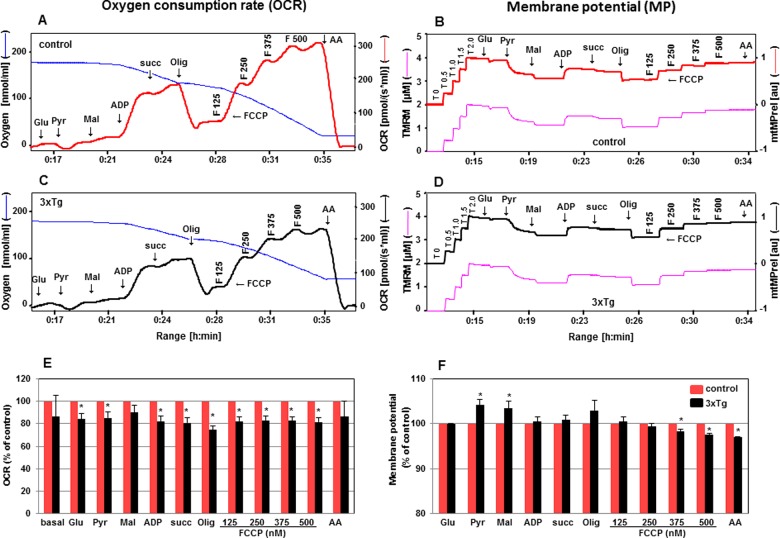
Figure 8. Determination of OCR and mtMP in cortex of mitochondria from 3xTg-AD mice.
Simultaneous evaluation of OCR and mtMP in the presence of TMRM is described in cortical mitochondria isolated from control (A, B in red) and 3xTg-AD (C, D in black) 6-month-old male mice. Changes of OCR and mtMP in 3xTg-AD mice (black) compared with control (red) are expressed in % in bar charts E and F respectively. Values are expressed as means ± S.E.M., n=3. *P<0.05 compared with control (unpaired Student's ttest).

