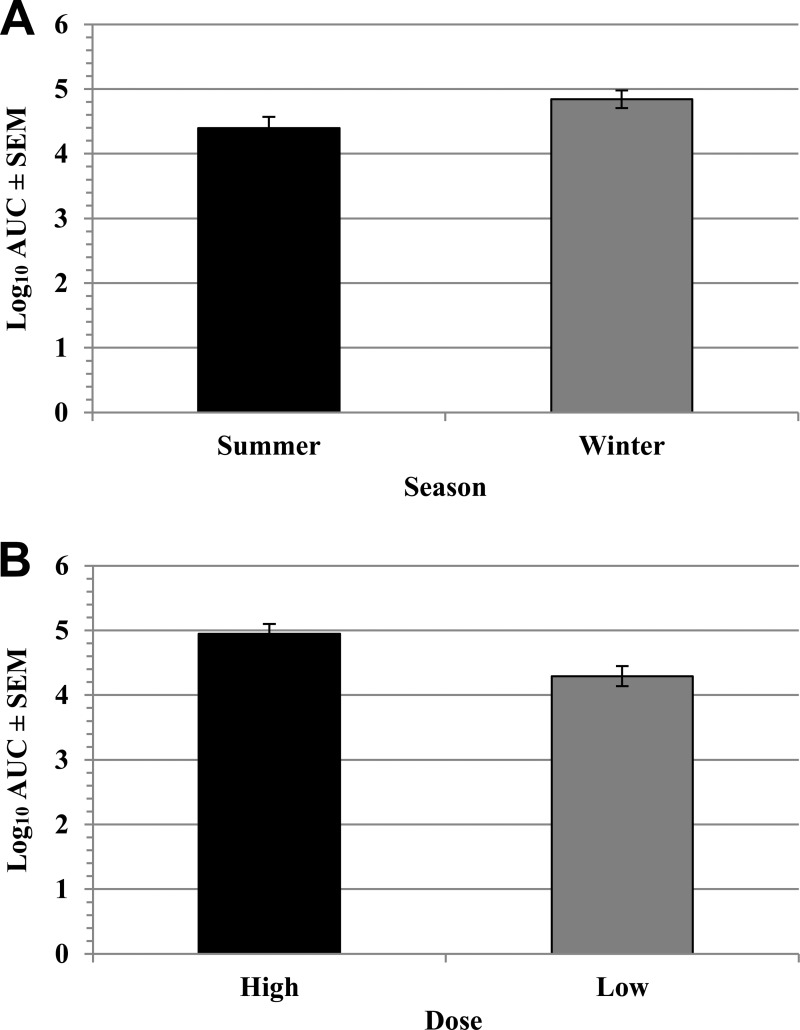
FIG 3.
Comparison of the effects of season and challenge dose on STEC O157 carriage. The numbers of STEC O157 CFU per RAJ swab during 56 days postchallenge were converted to a single area under the curve (AUC) value for each animal for each trial. Bars represent least-squares means, and error bars indicate standard errors of the mean (SEM). (A) Least-squares mean log10 AUC values by season. AUC values following the summer and winter challenges differed significantly (P = 0.0157). (B) Least-squares mean log10 AUC values by dose. AUC values after high-dose (109 CFU) and low-dose (107 CFU) challenges differed significantly (P = 0.0005).

