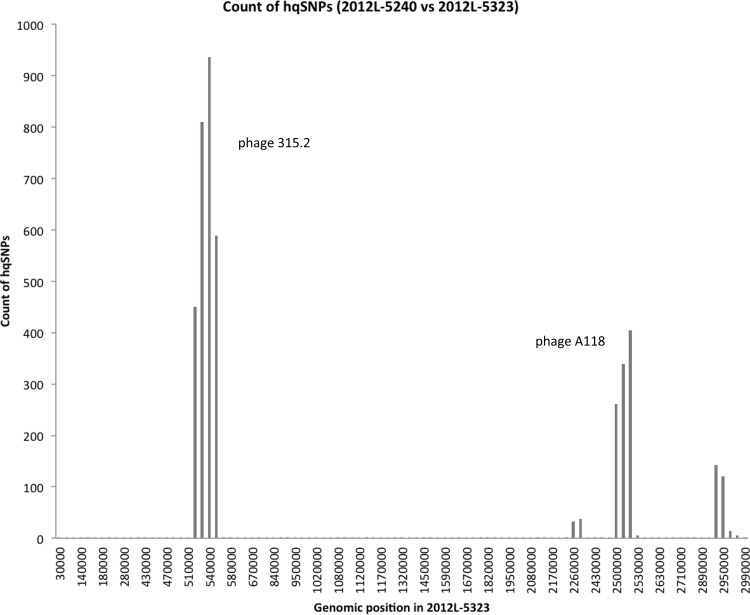
FIG 3.
hqSNP counts between CC101 clinical isolates 2012L-5240 and 2012L-5323 plotted against the position of a pseudochromosome for 2012L-5323. High-quality SNPs were determined using the raw reads of 2012L-5240 and mapping them against the assembly of 2012L-5323. The graph was produced by counting the number of hqSNPs per 10,000 positions in the assembly. Two phages as inferred by PHAST were each located in a region with high hqSNP counts; the two phages are identified near the corresponding hqSNP peak.

